In order to keep pace with CMOS scaling trends, alternative gate oxide materials, with a high dielectric constant, were proposed. To have a low interface trap density, good mobility, and good Atomic Layer Deposition (ALD) growth characteristics, the presence of an interfacial oxide layer is still prerequisite. Hydroxyl groups are the key players for the initiation of the ALD reaction.
From all the different methods to render a surface hydroxyl covered, a wet chemical oxide surface seems to be the perfect candidate, from a growth perspective. Deposition on a wet chemical oxide underlayer shows almost no barrier to film nucleation, enables linear and predictable growth at constant film density. Of course the interfacial oxide contributes to the EOT, therefore the thickness should be minimized. Ideally the silicon surface would be completely covered by hydroxyl groups, without having an underlying oxide. This combines the highest surface hydroxyl density with the lowest oxygen content. Clearly, scaling down the thickness of wet chemical oxides is necessary. The thickness of an ozone based wet chemical oxide can be tuned by controlling dip time, ozone concentration, temperature, … The next sections summarize the development of a concept to an industry ready process.
P type monitor wafers were used, which received an imec®-clean and a 30 second 2% HF dip. The resulting hydrophobic and oxide free, hydrogen terminated Silicon wafer is then subjected to the various wet chemical ozone treatments at 20ºC and without pH adjustment unless otherwise specified. The resulting oxide thickness is subsequently measured on a Plasmos SD2000 @ 633 nm or an ASET F5 from KLA-Tencor, both tools making use of the ellipsometry technique. Ozone was generated using a Sorbios SEMOZON 90.2HP ozone generator, at a flow of 2 l/min, except for the experiments as described in the flow through mode, where a MKS LIQUOZON® Single system is used. Ozone concentration was monitored using an electrochemical ozone cell from Orbisphere Model 31330.15, or the UV based ozone sensor delivered with the LIQUOZON® tool.
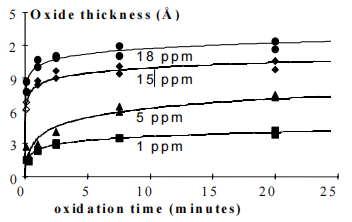
Static mode experiments are done by bringing ozone in a DI-water filled beaker through a quartz frit. Ozone flow is stopped during the dip of the wafers. Figure 1 shows that varying the time is not a good approach, because the initial oxidation rate is very fast making time control rather tedious. Lowering the ozone concentration, however, is clearly yielding thinner oxides, which proves the concept that the thickness of the wet chemical ozone oxide can be scaled down. Unfortunately, the resulting oxide, as measured by ellipsometry, shows a non-uniformity in thickness of more than 20%, the main part of this non-uniformity being a vertical gradient. A lower oxide thickness is observed at the top of the wafer. This is inherent to the set-up, because during the dip, ozone outgasses at the liquid air interface. In addition ozone concentration is reducing during the dip because the supply is stopped. This non-uniformity does not show up in the data of Figure 1, because oxide thickness was measured using the molybdenum blue method , which yields a wafer surface averaged oxide thickness.

Fig1
Water is re-circulated over a process tank in which a diffuser is bubbling ozone. During the dip, ozone supply is shut down. Static boundary layer thickness is reduced by the continuous flow, hence facilitating the ozone transport to the wafer surface. Figure 2 (solid markers and lines) shows the influence of ozone concentration and dip-time on the final oxide thickness. Oxide thickness increases with dip-time, but unfortunately non-uniformity does as well. A higher ozone concentration, 3 ppm instead of 1 ppm, yields a higher oxide thickness without a nonuniformity increase. Therefore it is better to control the ozone concentration to scale the oxide thickness, while keeping the dip-time short.
Upon cooling down the O3/DIW, reaction rate goes down as well as diffusion of reactants through the boundary layer. This makes the process less time critical. Figure 3 shows that, indeed, the slope of the oxide thickness versus dip-time curve is lowered, which is due to a reduced oxidation rate. Uniformity stays quite constant over the examined time window, which can be explained by a reduced O3 decay at lower temperature.