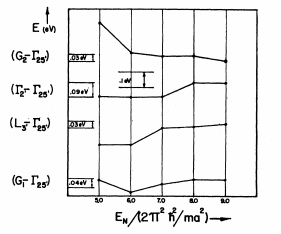
A detailed calculation of the energy bands of germanium and silicon has been performed by use of the pseudopotential method. The first three potential coefficients have been determined empirically, and all higher ones set equal to zero. This potential was used to compute the energy eigenvalues at~ 50 000 points throughout the Brillouin zone. By use of this sample, we calculated the imaginary part of the dielectric constant in the optical and near ultraviolet where direct transitions between the valence and low-lying conduction bands dominate the response. Photoelectric yield curves were obtained for comparison with recent experiments. In all cases agreement of theory and experiment was reasonable. Energy contours were constructed in several of the principal symmetry planes. These were used to explain the structure in the optical properties of Ge and Si in terms of transitions near certain important critical points. Effective masses and the static dielectric constant were also computed.
The previous energy-band work will, however, be used as a starting point. First of all, we sha)1 employ a simpliled version of the orthogonalized plane-wave method (OPW method) utilized in Refs. 3—9. Secondly, we shall make use of the eigenvalues at symmetry points in order to deduce the numerical values of the pseudopotential matrix elements used as computational parameters in this simplified approach (see Sec.III of this paper). A reasonably precise knowledge of these eigenvalues (or rather the differences between them) is necessary to undertake the present computations.
To sum up, the energy levels of Table I provide a model on the basis of which we can begin our detailed calculations. Hopefully we will be able to explain the frequency dependence of the optical properties. This w'ill enable us to establish the validity of Table I and provide us with a much broader understanding of the band structure than has heretofore been possible. Furthermore, the present work in the course of checking the level assignments of Ehrenreich et al. " and Phillips" will confirm or redefine their diagnostic techniques.
Ke now wish to do a band-structure calculation with the view of deriving es(co). A description of the logical framework to be employed is the following. First a method of computing the bands will be proposed. The method should have a small number of disposable parameters. In order to determine these parameters, the term scheme discussed in Sec. I will be used as a starting point. Having set the parameters, we shall then proceed to 6nd the bands throughout the Brillouin zone. From the band structure es(co) can be computed. If the dielectric function agrees with experiment, we shall conclude that both the model of Sec.I and the computed band structure are correct. Should there be substantial disagreement then a consistent alternate to the starting term scheme will be tried, and a corrected band structure found. A schematic diagram of this is shown in Fig. 2.
It was of interest to compute the energy bands along symmetry directions. These are shown in Fig. 6, and should be compared w'ith earlier results obtained by Herman on Ge and by Kleinman and Phillips for Si. We should point out that the good behavior of our bands was used as an indication of both the convergence of our computational procedure and of the correctness of the pseudopotential approach.

Fig1
The Si data are understood similarly. The L& -+ L& transition is responsible for the peak at 5.3 eV. The somewhat large peak at 5.8 eV is apparently a boundary sampling error of the type discussed in connection with the 4—5 histogram. After matrix elements are accounted for, the remaining structure in X4,6 is too weak to make an observable contribution to the optical properties. For the same reason the remaining histograms contribute nothing to es(ra).
To check our hypothesis regarding matrix elements it was decided to do Si with matrix elements included. |Mn,s(K)|2was computed along with the energy eigenvalues at each point of the zone, and put in Eq. (1). This added about 3 h of machine time to a total of about 15 h. The result for es(cu) shown in Fig. 16(b) includes all of the separate histograms.
上一篇: 硅上的低温锗薄膜
下一篇: 衬底二极管对硅锗光电晶体管性能的影响