1. Si2p and F1s XPS spectra of Si3.4N4 before and after etching in HF and NH4F
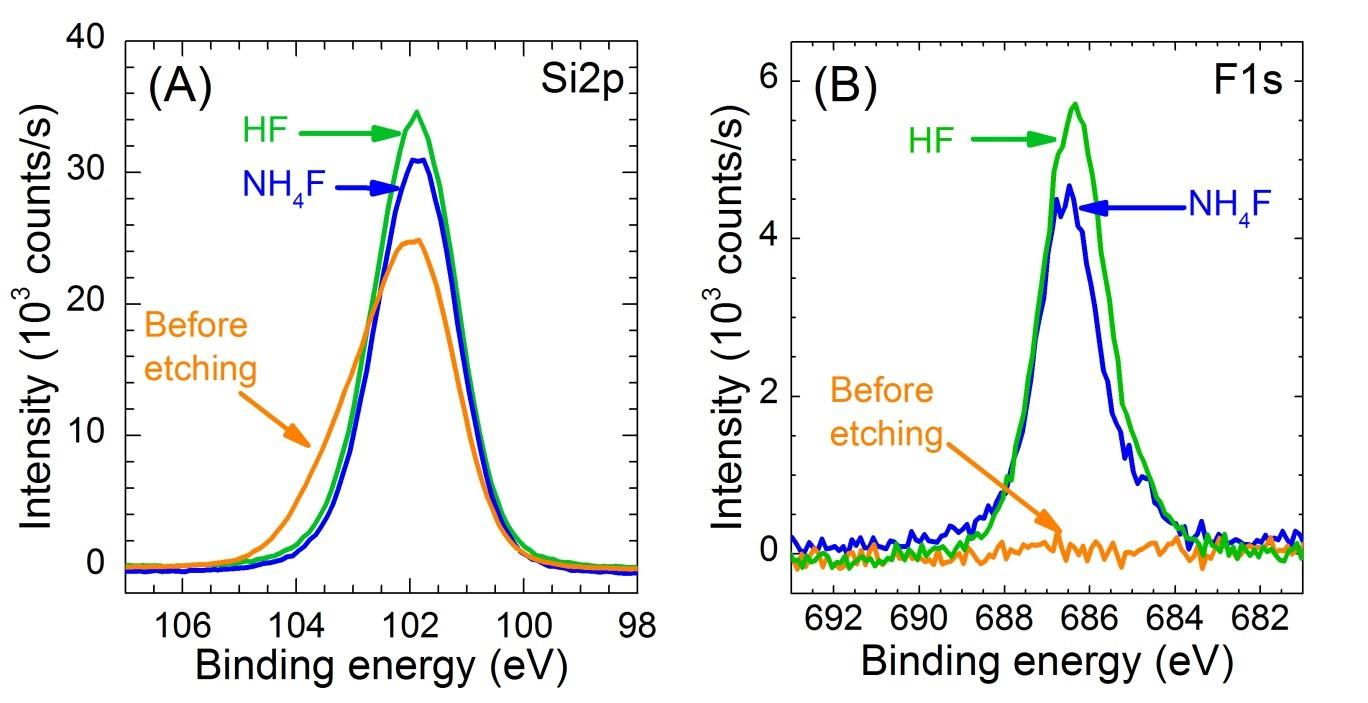
Figure S1. XPS spectra of the (A) Si2p region and (B) F1s region for a Si3.4N4 surface as received (orange), after a 30 s 0.2% HF etching (green) or a 15 min 40% NH4F etching (blue). The loss of the high-energy component in the Si2p peak reveals the dissolution of the native oxynitride layer upon etching.
2. F1s XPS spectra of Si3.4N4 after etching in 0.2% HF for 30 s and Si-F surface concentration determined by XPS
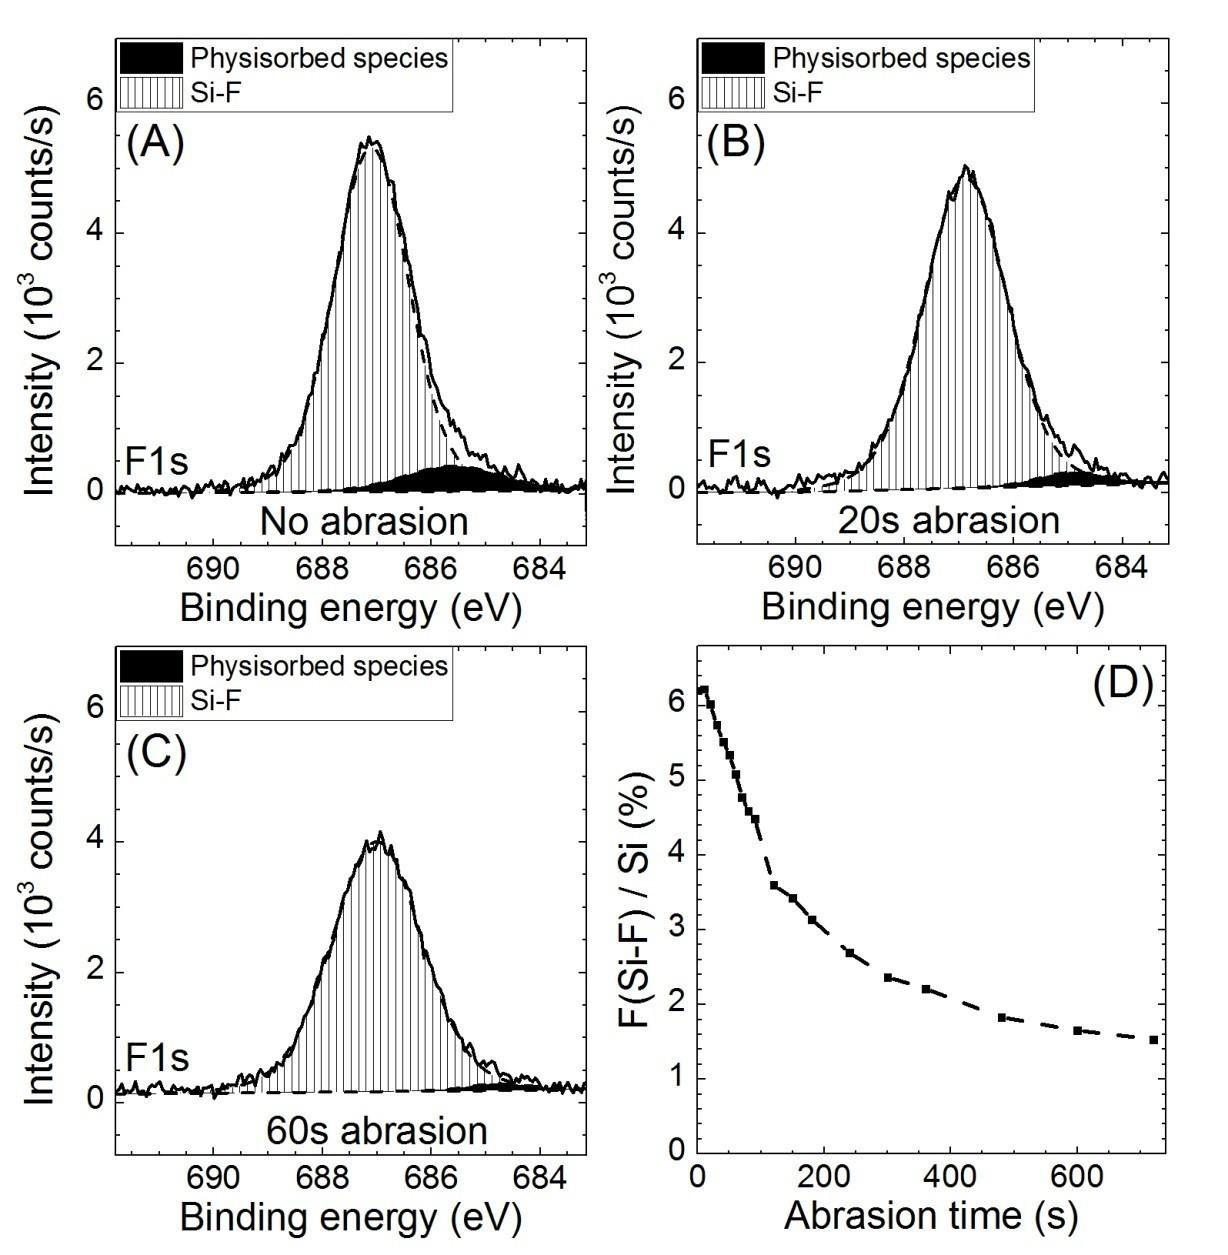
Figure S2. F1s XPS spectra reconstruction of a 30 s 0.2% HF etched Si3.4N4 surface (A) before and after (B) 20 s and (C) 60 s of ionic argon cluster abrasion and the ratio between the Si-F contribution of the F1s peak area and the Si2p peak area with ionic argon cluster abrasion time (D). The fast disappearance of the low-energy contribution is consistent with its attribution to physisorbed fluorinated residues. The disappearance of the main F1s contribution upon prolonged abrasion shows that the corresponding Si-F species are located at the surface.
3. Coomassie Brilliant Blue (CBB) dosing
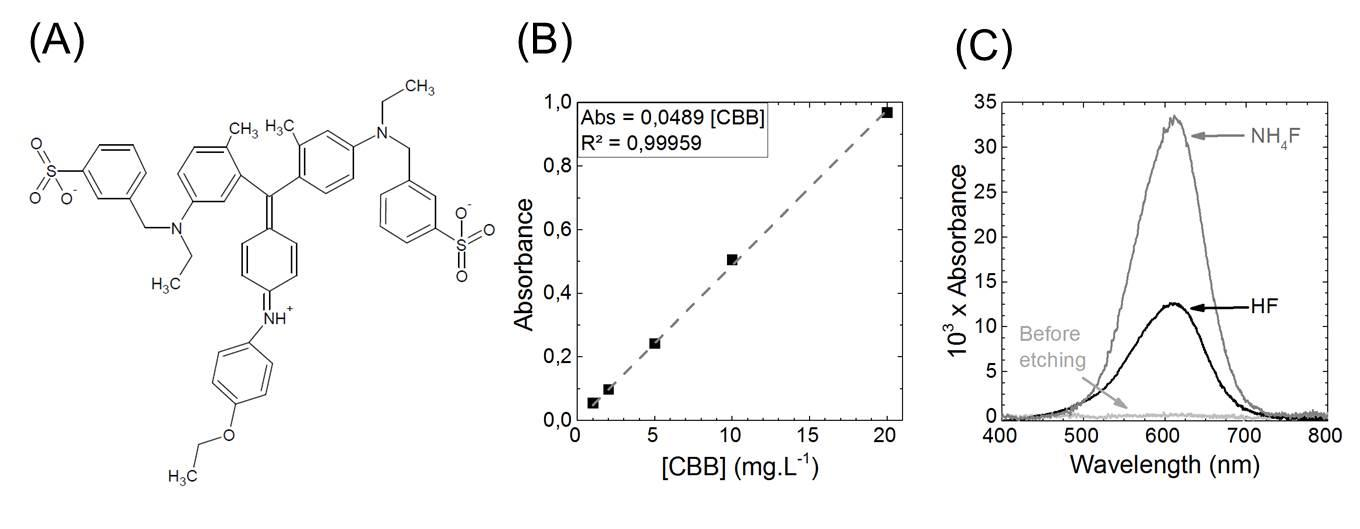
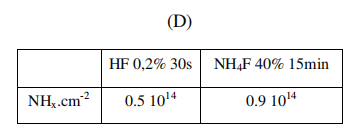
Figure S3. (A) Coomassie Brilliant Blue molecule (B) Calibration curve of the CBB absorbance as a function of CBB concentration (C) UV-visible spectra of the rinsing solution after surface exposure to CBB. A piranha-cleaned surface exhibits an undetectable amount of CBB (light grey), whereas a surface etched in 0.2% 30 s HF (black) or 40% 15 min NH4F (dark grey) exhibits a UV absorption enabling to quantify the CBB amount in solution (D) The NHx surface value for the HF & NH4F rinsed surface deduced from the spectra shown in (C).
4. SiOH determination by IR-ATR
In ATR geometry, the density of molecules grafted onto a surface can be calculated from the integrated absorbance of the signal associated with a vibrational mode of the molecules. The infrared cross section of this mode has to be known first. This quantity can be determined from the absorption of the considered mode measured in a liquid-phase experiment in the same ATR geometry (calibration). For the determination of the SiOH bonds on the surface, the bending mode CH3 of HMDSO in CDCl3 was chosen to perform the calibration. More details (for the equations) are found in the literature.
Figure S4(B) shows the resulting spectrum in p-polarization. The Ap,s of HMDSO are deduced by fitting the CH3 recorded for p- and s- polarization.
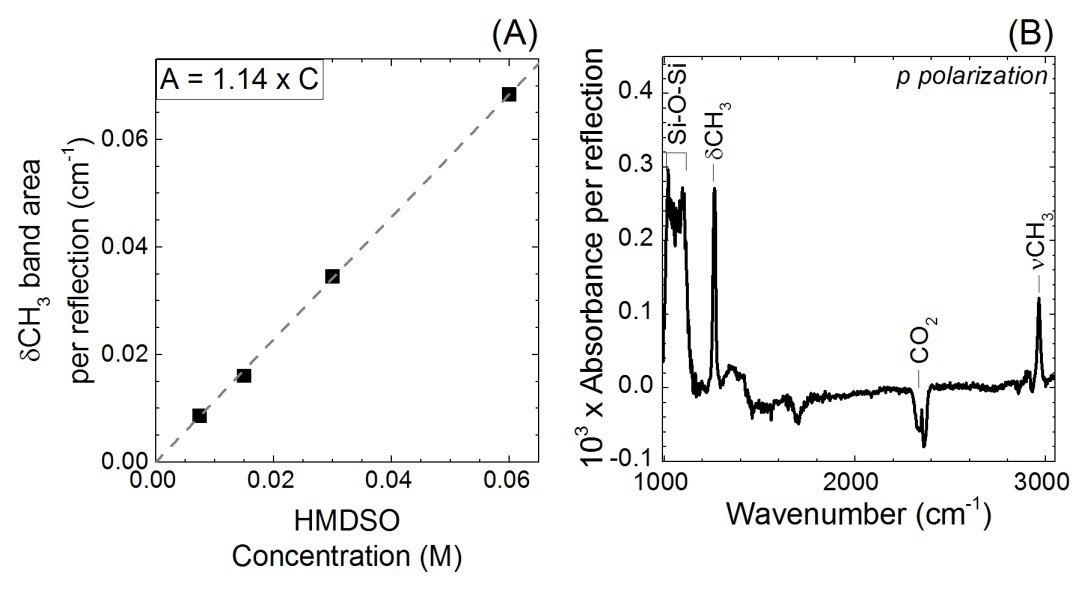
Figure S4. (A) Calibration curve of hexamethyldisiloxane (HMDSO) in CDCl3 from the integrated area of the δCH3 band from 1200 to 1300 cm-1 (B) ATR-IR spectra in p-polarization for a 30 s 0.2% HF etched Si3.4N4 surface after reaction with hexamethyldisilazane (HMDS). The reference is the etched surface.
5. Dissolution rate of Si3.4N4 surface in 40% NH4F solution
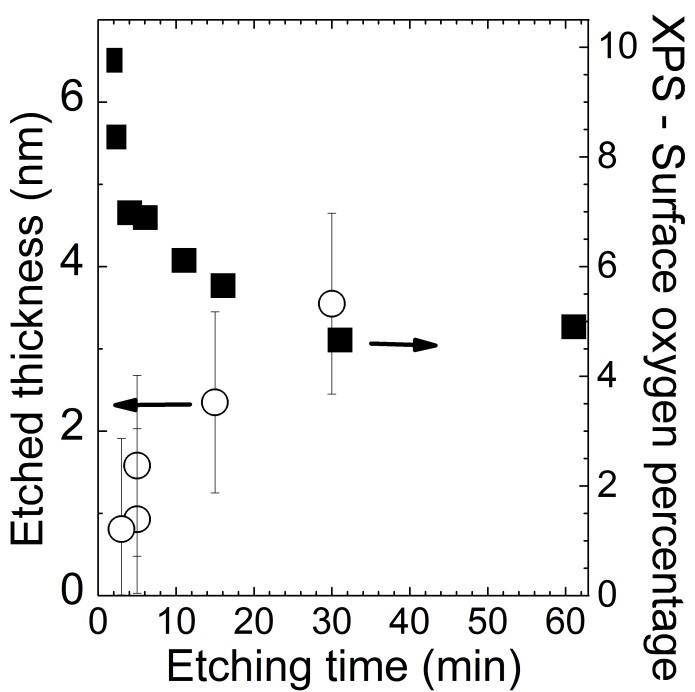
Figure S5. Etched thickness deduced from spectroscopic ellipsometry measurements (open circles) and the corresponding surface oxygen percentage (closed squares) deduced from the XPS spectra after a 40% NH4F etching of a Si3.4N4 surface for various duration of the etching time.
6. SiHx determination by IR-ATR
For the determination of SiHx groups on the surface from all of the SiHx vibrators between 2000 and 2300 cm-1, the stretching band of tetramethyldisilazane solution at 2120 cm-1 in ethanol solution was chosen to perform this calibration.
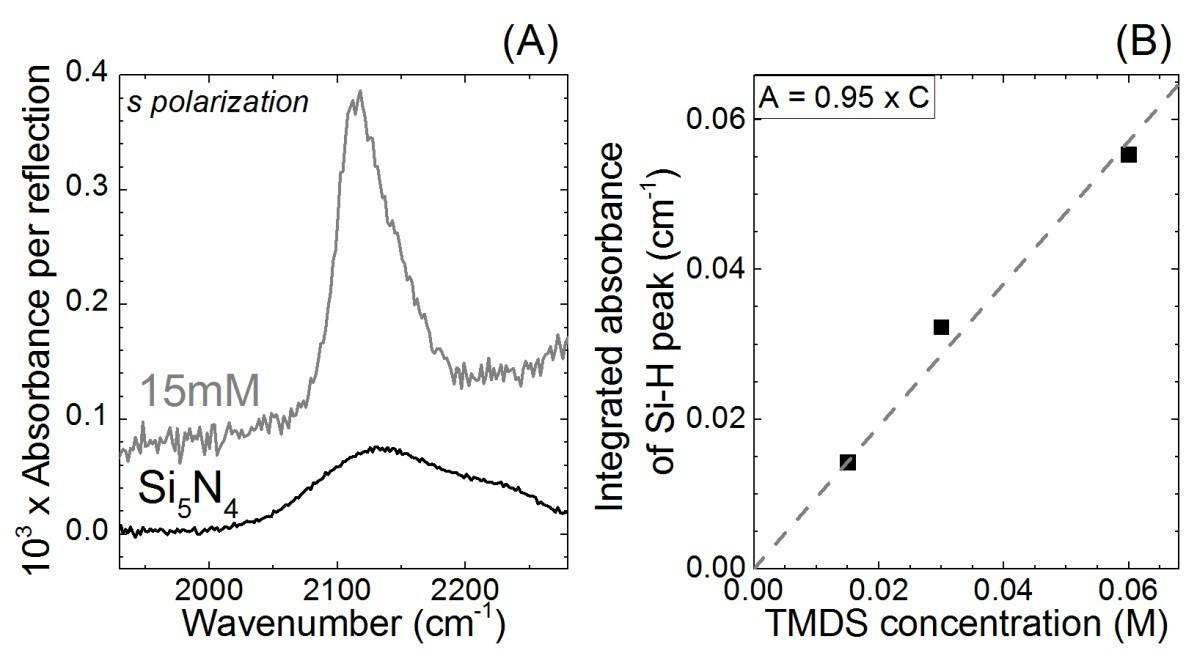
Figure S6. (A) ATR-IR spectra in s-polarization for a tetramethyldisilazane solution in ethanol and a Si5N4 surface etched in HF (2%, 30 s) (B) Calibration curve of the tetramethyldisilazane from the integrated area of the Si-H band from 1980 to 2280 cm-1.
7. AFM images of the HF-etched Si3.4N4 and Si5N4 surfaces
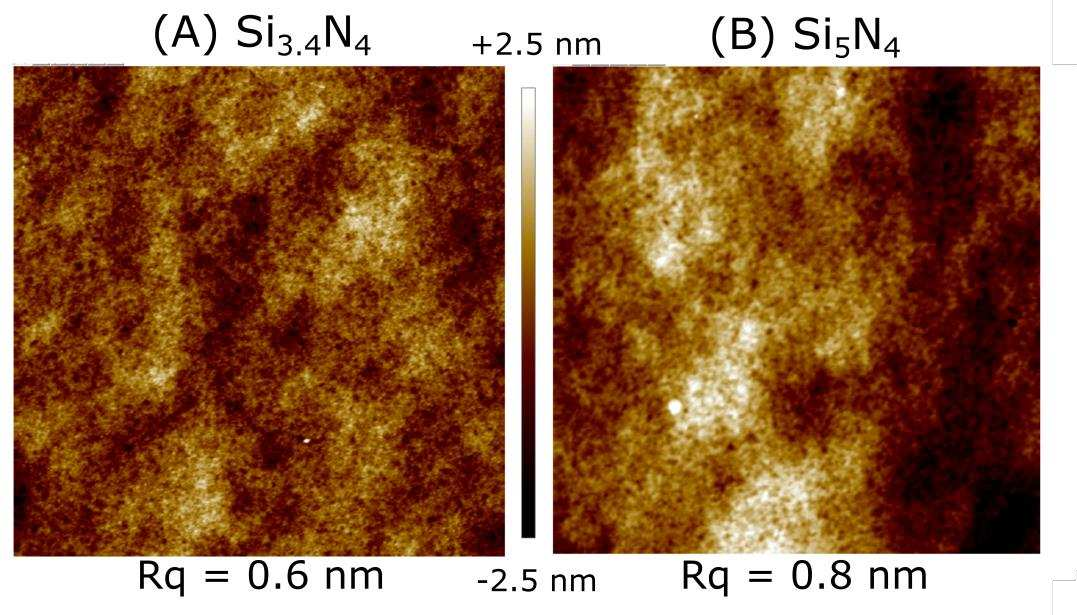
Figure S7. AFM (5×5 µm2 ) of a Si3.4N4 (A) and a Si5N4 (B) surface etched in HF (2%, 30 s). AFM images were obtained using a Bruker Veeco diNanoscope V-ICON microscope, in tapping mode, with silicon nitride cantilever. The images were processed using the Nanoscope Analysis software. Notice the slight increase in the roughness in the case of Si5N4: the image root mean square average (Rq) is around 20% higher.
下一篇: 硅、锗、砷化镓和磷化镓的化学蚀刻