There is a need to classify and standardize graphene-related materials giving the growing use of this materials industrially. One of the most used and more difcult to classify is graphene oxide (GO). Inconsistent defnitions of GO, closely relating it to graphene, are found in the literature and industrial brochures. Hence, although they have very diferent physicochemical properties and industrial applications, commonly used classifcations of graphene and GO defnitions are not substantial. Consequently, the lack of regulation and standardization create trust issues among sellers and buyers that impede industrial development and progress. With that in mind, this study ofers a critical assessment of 34 commercially available GOs, characterized using a systematic and reliable protocol for accessing their quality. We establish correlations between GO physicochemical properties and its applications leading to rationale for its classifcation.
Graphene oxide (GO) is a member of a family of two-dimensional (2D) materials, derived from the oxidation of 2D graphitic structures (sp2 to sp3 carbon conversion). As any other 2D material, in powder form GO presents a statistical nature in terms of its thickness and lateral size distribution. However, GO is an amorphous and nonstoichiometric 2D material, bearing a blend of diferent functional oxygen groups. In fact, there is no consensus on how to represent the structural model for GO. Hence, important structural details are ofen neglected, including metallic impurities, functional groups of other heteroatoms, carbon vacancies and radicals, and C–H bonds, which directly depend on the oxidation method used.
Tere is a plethora of methods available to obtain GO, including the chemical, electrochemical and microbial oxidation of a variety of carbon-based materials. Te most common results found in the literature involve GO obtained via chemical oxidation of graphite or, most recently, the direct fast oxidation of graphene. However, when considering commercially available GO, it narrows down to the almost exclusive use of chemically oxidized graphite.
Concomitantly with any other member of the 2D materials family, the GO dimensions imply dramatic efects on its properties, to such an extent that it can defne the formation of liquid crystal phases in water. Consequently, variations in the dimensions of GO fakes yield diferent products for diferent applications, especially in areas such as polymer composites where interphase efects are critical.
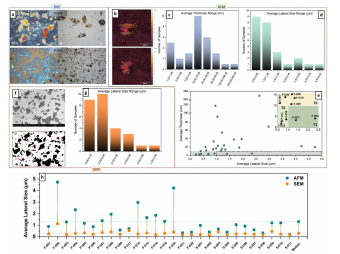
Optical microscopy (OM) is the simplest method to estimate the lateral size of GO’s fakes. However, it can only be used to observe sample appearance prior to more quantitative characterizations, as defned by the ISO norm related to graphene. Although this approach is ofen found in the GO literature, we observe a large discrepancy among samples and their optical defnition when using the ISO-recommended substrate composition (Si/SiO2) for non-purifed commercial GOs. Samples with large fakes and fewer impurities are clearly observed with OM, whereas smaller and more contaminated fakes are barely visible due to artifacts created by the interaction between the Si/SiO2 substrate and organic contaminants. Tis can be partially resolved by using Si substrates, although losing the qualitative information of fake thickness (Fig. 1a). For this reason, all samples were analyzed using both Si and Si/SiO2 substrates, and the one presenting the most defned fake morphology and distribution was used for further characterizations (Figure S2).

Fig1
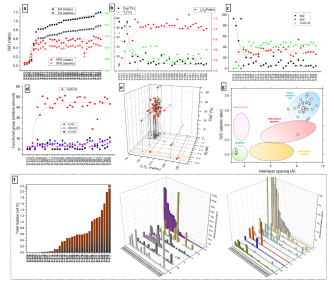
Besides its GO dimensions, another critical issue-defning GO’s quality is the fact it is an oxide. Tus, the degree of oxidation and the types of oxygenbearing groups it contains defne its range applicability. Te most commonly used analytical methods to defne the degree of oxidation and functionalities in GO are elemental analysis and XPS. Due to its larger availability and smaller amounts of sample required for characterization, XPS is ofen used to cover both oxidation and functional group determinations. Moreover, for similar GO samples presenting variations in the oxygen content, the degree of oxidation can be precisely determined using a combination of XPS and computational methods1 , and correction methods are available to mitigate the efect of extraneous oxygen contamination. However, since our target samples are prone to heterogeneity and XPS is a surface-targeted analysis, we decided to interpolate the oxygen/carbon ratios (O/C) obtained by both XPS (SI, Sect. 6, Table S1) and elemental analysis (EA, SI Sect. 7, Table S2). For easier visualization of the correlations, in Fig. 2, the GO samples were ordered with ascending O/C values (as obtained by EA). Indeed, a large discrepancy between XPS and EA builds up with increasing oxygen content (Fig. 2a). Te O/C elemental ratios obtained by both methods are comparable only in the 4 GO samples with low O content. For the rest of the samples, XPS-based O/C values are lower by~0.2–0.3 in comparison to EA, including extreme cases where the values difer by>50% (Fig. 2a). Since EA is a bulk-based analysis and uses large amounts of sample, we adopt its O/C and C/O values as a reference, while XPS is used only for functional group quantifcation.

Fig2
Important correlations are obtained by interpolating XPS, Raman spectroscopy, and TGA (Fig. 2b, details in SI, Sects. 6, 8, and 9, respectively). Since the samples are ordered with ascending O/C values, the increased degradation of the crystalline basal plane can be witnessed by the decreasing amount of C sp2 (by XPS) and increased number of defects (ID/IG ratio by Raman), leading to decreased thermal stability (by TGA). Te C sp2 consumption also correlates directly with the increase in C sp3 and the formation of epoxy functionalities (>O/C–O), all obtained by XPS (Fig. 2c). We chose>O/C-O as a reference oxidation group because at higher degrees of oxidation it becomes the dominant functionality. With only 2 exceptions, all GOs with O/C> 0.5 form a plateau at ~ 45%>O/C-O in their composition, as witnessed in Fig. 2d. Although on a much smaller scale, C–OH functionalities also vary largely among GO samples (Fig. 2d), which is a clear fngerprint of the presence of water during the chemical oxidation process29,30. A clear correlation emerges when we interpolate the information about the GOs’ defects by Raman (ID/IG), their degree of oxidation by EA (O/C), and their amount of sp3 carbon by XPS (C sp3 ) (Fig. 2e). Relatively small distribution regions could be attributed to these values, where 27 out of 34 GO samples presented 0.9≤ ID/IG ≤1.2, 0.8≤O/C≤1.2 and 25%≤% C sp3≤42%. Among the 7 outliers are the 2 decoy GO samples we introduced, presenting a clear diferentiation from the highly defective and low oxidation “GOs”.
Finally, we also investigate the content of residual metallic impurities present in the commercial GOs, using ICP-OES (details in SI, Sect. 12, Table S8). Tere are two main sources of the metallic residues in GO, the graphite used for oxidation and the major components of the reactants used in the diferent synthetic steps. However, indirect contamination with extraneous metals coming as trace residues of reactants have also been reported10. Consequently, purifcation steps are essential for the GO syntheses due to their large chemical footprint, but they considerably increase the production cost of GO. Tus, impurities become a point of concern when acquiring GO from a seller. In Fig. 2f, we summarize the total amount (by weight), the major (present in thousands of ppm) and the minor (present in hundreds of ppm) metallic impurities present in the commercial GOs. Tey were organized in ascending order of the major component of the fgure for better visualization. Astonishingly, 8 of the samples presented>1wt.% of metallic residues, including an extreme case with>4wt%. Te majority of the largely contaminated GOs are powder samples, whilst, with 3 exceptions (S-004, S-006 and S-011), dispersion samples presented orders of magnitude less impurities. Te major contaminants observed are Mn and Na, followed by K, Mg, Ca and Fe, present in thousands of ppm. Tese contaminants are easily traceable since they are part of reaction components and/or cations largely present in water36, tracing it back to the water in the washing process. However, Al and Cr were also present in surprisingly large amounts in some GOs (hundreds of ppm), while Pt, Zn, V, Cu, Co, Se and Ba were lesser (but still in tens of ppm in some samples).
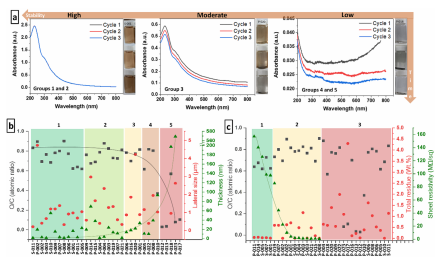
The flm formation properties are among the most desired properties of GO making it applicable in areas as diverse as programable membranes for ion segregation, water purifcation and desalination, biomedical sensors, and mechanically reinforced nanocomposites. For this reason, following the study on the water stability of the commercial GO samples, we test their flm formation properties. Moreover, since GO is well-known as an insulator and this condition is dependent on its degree of oxidation, we characterize the sheet resistivity of the flms formed. Due to the heterogeneity that is anticipated for the samples, and the knowledge that impurities and oxidative debris tend to collapse the GO flm structure, we facilitate the flm formation by applying a solvent mixture/isopycnic centrifugation-based method. Tis is made to increase the chances of flm formation, improve the quality of formed GO flms, and, consequently, increase the accuracy of measurements (details in SI, Sect. 17).
Surprisingly, only half of the GO samples could form a flm or a continuous structure that was stable enough to be characterized. In fact, only about 6 out of the 34 samples were able to form continuous and homogeneous flms, all derived from commercial GO dispersions (SI, Sect. 17, Figure S19). Moreover, except for one GO belonging to stability group 3, all GO samples that can form flms belong to dispersion stability groups 1 and 2 (Fig. 3b), confrming an obvious correlation between GO stability and flm quality.

Fig3
Afer our extensive evaluation of the quality of GOs worldwide, we concluded that only 4 out of the 34 samples analyzed display an acceptable performance within our protocol and deliver approximately what they display on the label or brochure as the content of their commercial product. Similarly to previously reported for graphene, residual contamination from processes and prime materials, and fake thickness were major issues, but in a much larger scale due to the heavy chemical footprint of the GO production process (about half of the samples presented > 5000 ppm in metallic residues). However, inconsistencies in lateral size and degree of oxidation were also vast, to an extent that diferent analytical methods yielded diferent results due to the heterogeneity.
Finally, we would like to highlight that this critical assessment of the quality of commercial GOs should be taken as an eye-opener, and was designed with the intention to promote and suggest directions to speed up the standardization of GO as a product. Understanding that the felds of GO application are vast, and considering the many steps involved in GO’s preparation, afer this extensive and laborious analytical exercise we prospect that an all-in-one quality control protocol is most likely unattainable. However, we could establish 3 main cores of evaluation that may guide the adaptation of these protocols to the specifc needs. Te frst 2 are structurally focused and consist in the dimensional (Fig. 1) and compositional (Fig. 2) determination of the GOs, while the third one correlates the frst 2 with their dispersion stability and flm formation (Fig. 3). Altogether, we anticipate that well-regulated and standardized application-based grades are the way-to-go for GO, since they can accommodate the limitations and tolerances allowed by individual applications.