Commercially available Si powder was immersed in a solution of 5-20 mM silver nitrate (AgNO3) and 5 M HF for a controlled time. Immediately after rinsing, the silver deposited silicon powder was immersed in an etchant consisting of 5 M HF and 1.5% H2O2 at 50 ℃ for 1-3 hr to produce silver catalyzed etched Si materials. Depending on the deposition time of silver nitrate, the size of silver particles was varied (Fig. S1(a-c)). During electroless deposition of silver, nanopits were also observed by etching in HF solutions. When the silicon powder having various silver particle sizes was soaked into an etchant, composed of 5 M HF and 1.5% H2O2, at 50 o C for 1 hr, nanoporous silicon nanowires, which protrude out from intact silicon core, were produced with different length and pore size (Fig. S1(d~f)). In addition to size of silver catalyst, the concentration of H2O2 that act as an oxidant is another controllable parameter to tune the Si morphology. As the H2O2 concentrations of 1.0, 1.5, and 2.0% were used at a fixed HF concentration (5 M), shallow nanopits, Si nanowires, and Si macropores were prepared, respectively (Fig. S2). To obtain multidimensional Si powders that nanoporous Si nanowires protrude out from microscale Si matrix, silver deposited Si samples were etched in a 5 M HF and 1.5% H2O2 at 50 o C for 3 hr. As-synthesized Si powders were immersed in 5% HF for 1 min to remove silicon oxide onto the surface of etched Si, and followed by drying in a vacuum oven at 100 o C for 2 hr to remove water completely. Subsequently, the etched Si samples were coated by carbon by thermal decomposition of acetylene gas at 700 o C for 20 min in quartz furnace.
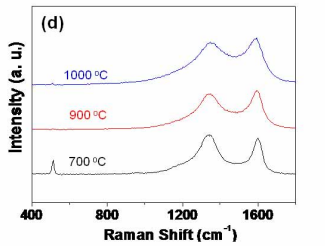
We investigated the effect of carbon coating condition on the electrochemical performance. The SEM images of mSi carbon-coated at 700, 900, and 1000 o C do not show the distinct difference (Fig. S3(a-c)). Therefore, Raman and FT-IR spectrum were obtained to characterized three different samples. Figure S3d shows the Raman spectra of multidimensional Si carbon coated with decomposition of acetylene gas at 700, 900, and 1000 ℃. From the two peaks appearing at ~1360 (D band) and ~1580 cm-1 (G band), the dimensional ratio of the D and G bands of samples carbon coated at 700, 900, and 1000 o C are 2.5, 2.1, and 3.1, respectively. The FT-IR spectrum of sample prepared at relative low temperature (700 ℃ shows incomplete decomposition of acetylene molecules appearing at ~1640 cm-1, which is associated with the vibration of carbon (vinyl bonds) skeleton of the sample (Fig. S3(e)). In case of samples coated at 1000 ℃, incomplete decomposition of acetylene gas was not observed, but lower degree of graphitization was obtained due to small amount of oxygen remaining carbonization process (Fig. S3(d & e)). All three samples were prepared with a similar carbon content of ~ 30wt% at three different temperatures. In order to compare the electrochemical performance of three samples, galvanostatic discharge/charge experiments were carried out. Figure 6f shows the voltage profiles of the three c-mSi anodes at 0.1 C rate between 1.2 V and 0.01 V. The first cycle discharge capacities are 3200, 2440, and 2290 mAh/g for the electrodes of multidimensional Si carbon-coated at 700, 900, and 1000 ℃, respectively, with the corresponding first charge capacities of 2630, 2150, and 1900 mAh/g. Therefore, the coulombic efficiencies in the first cycle are 65%, 88%, and 85% for the three different Si samples carbon-coated at 700, 900, and 1000 o C, respectively. The cycling performance of samples with high degree of graphitization is superior to that of low degree samples (Fig. S3(g)).

Fig1
Effect of carbon-coating temperature on the electrochemical performance. SEM images showing mSi carbon-coated at (a) 700, (b) 900, and (c) 1000 o C. (d) Raman spectra of Si anodes coated with carbon at 700, 900, and 1000 o C. (e) The corresponding FT-IR spectrum of each anode materials. (f) Voltage profiles for the first galvanostatic cycles of the c-mSi at the 0.1 C rate. All three samples have a similar carbon content of ~28 wt%. (g) Charge capacity versus cycle number for the carbon-coated Si at the 0.1 C rate. The carbon coating condition affects the initial capacity and cycling retention. Square, circle, and triangle symbols represent the carbonization temperature of 700, 900, and 1000 o C, respectively.
上一篇: 通过蚀刻控制凹面金属纳米粒子的形状
下一篇: 一种用于聚集晶圆芯片电气故障的创新方法