Abstract
Nowadays, the major semiconductor manufacturing companies try to fabricatesmaller nodes (up to ~2 nm) by using the current start-of-the-art EUV lithography system.As a result, the particle size of interest becomes smaller. Preventing and controlling particlecontaminations is essential in the semiconductor manufacturing process to increasesemiconductor yield. Examples of these unwanted nanoparticles in the semiconductorindustry are airborne molecular contamination (AMC), haze, and deposited nanoparticles.For these reasons, to control and reduce nanoparticle contamination in the semiconductormanufacturing process, particle formation, transport, deposition, and filtration studiesshould be simultaneously investigated. The objectives of this study were to 1) demonstrateparticle formation in a particle-free environment, 2) investigate particle deposition andtransport characteristics in commercial gas pipelines, and 3) present a new analyticalequation for calculating the pressure drop of nanofiber filter media.
1.1 Background
Due to the extraordinary size-dependent physicochemical properties ofnanomaterials, engineered nanomaterials have been widely applied in various fieldsincluding semiconductors , energy , filtration and health. Although these engineered nanomaterials are beneficial tothe development of nanotechnology, additional concerns have been raised that unwantednanoparticles which are unintentionally released into the environment during the processof manufacturing, usage, and disposal may have adverse direct or indirect effects on livingorganisms including humans . Moreover, preventing and controlling particlecontaminations is essential in the semiconductor manufacturing process to increase semiconductor yield. Examples of these unwanted nanoparticles in the semiconductorindustry are airborne molecular contamination (AMC), haze, and deposited nanoparticles.Also, manufacturing equipment like chemical vapor chambers and epitaxial growthreactors can generate lots of nanoparticles. Therefore, great efforts have been made to maintain a particle-free environment(such as cleanrooms) using high-efficiency particulate air (HEPA) filters and ultra-lowparticulate air (ULPA) filters in the semiconductor manufacturing process.
1.1.1 Particle contamination State-of-the-art fabrication facilities such as semiconductors manufacturing plants have required stringent standards to control particulate and gaseous contaminants in cleanrooms to improve product yield since the deposited nanoparticles on masks or wafers can cause defects in semiconductor chips . Microprocessor manufacturing in the semiconductor industry consists of several manufacturing process steps. The manufacturing process steps which can be sensitive to particle contamination can be generally categorized as shown in Figure 1.1 . One of the most prevalent defects scenarios in integrated circuits (ICs) is Particles in trenches or holes as shown in Figure 1.1a. The deposited particles between the two metal layers disrupt the conductivity and cause defects in ICs. The simple transistor schematic diagram is described in Figure 1.1b. If particles were deposited on the gate area, it causes poor transistor performance. Figure 1.1c shows a ghost pattern in the final product even thoughdeposited particles are resuspended or removed. Compared to particles in the mask case,particles inhibit the etching process on a patterned wafer, resulting in a short circuit.
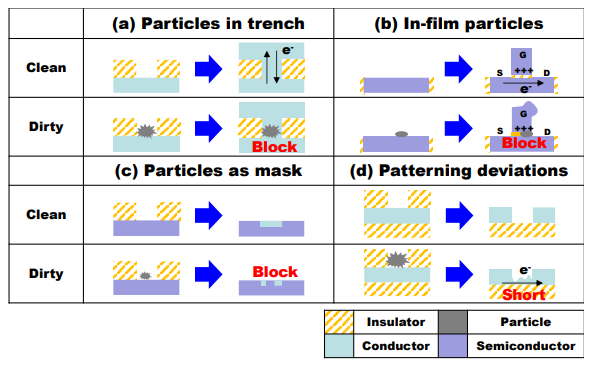
Figure 1.1 Typical particle defects scenario schematic in integrated circuits (ICs) (MartinKnotter and Wali, 2010). (e-: electron, S: source, D: drain, g: Gate)
1.2 Research objectives
As shown in Figure 1.2, to control and reduce particle contamination in thesemiconductor manufacturing process, particle formation, transport, deposition, andfiltration studies should be simultaneously investigated. The objectives of this study wereto 1) demonstrate particle formation in a particle-free environment, 2) investigate particledeposition and transport characteristics in commercial gas pipelines, and 3) present a newanalytical equation for calculating the pressure drop of nanofiber filter media.
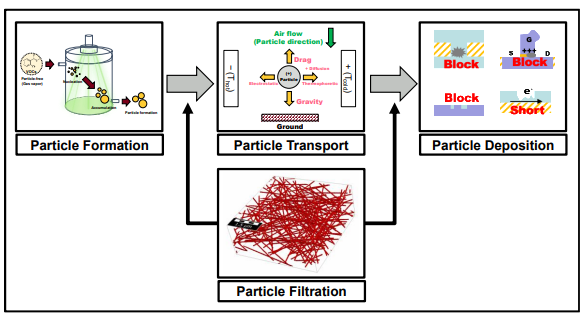
Figure 1.2 Particle formation, transport, deposition, and filtration in the semiconductormanufacturing process.
2.2 Experimental methodology
Figure 2.1 shows the experimental setup for detecting methyl salicylate vaporsusing a soft X-ray and scanning mobility particle sizer. The compressed air wasdehumidified and purified through calcium sulfate (DH, CaSO4), granular activated carbon(GAC), and a high-efficiency particulate air filter (HEPA). The purified air carried MeSvapors released from a permeation tube device (Methyl Salicylate, CAS no. 119-36-8, PD3160-CR, VICI Metronics Inc., WA, USA) which had a permeation rate of 3000 ng/min (PRref) at 70 oC (Tref), and temperature of the permeation tube device was controlled by atemperature controller (Dynacalibrator, Model 150, VICI Metronics Inc., WA, USA) as 50oC or 70 oC with an accuracy of ± 0.01oC. The flow rate through the permeation tube device(Qp) was fixed as 0.4 L/min, and the dilution flow rate (Qd) was controlled as 2.0 ~ 10.0L/min for adjusting MeS vapor concentration ([MeS]). The permeation rate (PR) wasdetermined as follows .

Figure 2.1 Experimental setup for detecting methyl salicylate vapors using the soft Xray and the scanning mobility particle sizer.
2.3 Results and discussion
To investigate the effect of reaction time through the soft X-ray chamber, the flowrates through the soft X-ray chamber were changed to 0.5, 1.0, 1.4, and 1.8 L/min, as shownin Figure 2.2. We obtained MeS vapor concentration as 201 ppbv (parts-per-billion byvolume, 10-9) by controlling the temperature of the MeS permeation tube device as 50 oC,and the additional flow rate as 2.0 L/min. In general, when the flow rates through the softX-ray chamber increase, the reaction time inside the soft X-ray chamber is reduced becausethe bulk residence time of MeS vapors inside the chamber decreases. It should be noticedthat the investigation of volume concentration is more reasonable rather than one of numberconcentration, especially varying the reaction time, because the soft X-ray photochemicalprocess is a mass-based conversion process . Asshown in Figure 2.2a, the volume concentrations of MeS nanoparticles (MeSNPs) linearlydecrease with the increased flow rates through the soft X-ray chamber. Furthermore,particle mode size, i.e., the highest peak seen in particle size distribution, decreases whenthe reaction time increases, as depicted in Figure 2.2b. These results imply that it isimportant to choose the appropriate flow rates through the soft X-ray chamber dependingon MeS vapor concentrations. In this study, the flow rates through the soft X-ray chamber were fixed at 0.5 L/min, for detecting the ppbv-level of MeS vapor concentrations.
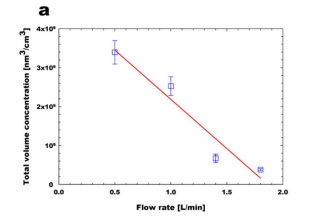
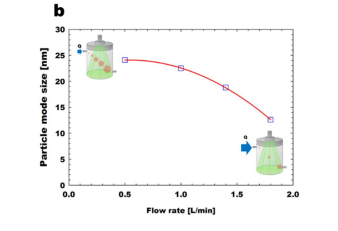
Figure 2.2 Effect of flow rate through soft X-ray chamber: (a) total volume concentrationof generated MeS nanoparticles; (b) particle mode size of generated MeS nanoparticles.
The particle volume size distribution was measured as time changed by using theSMPS, to investigate the conversion MeS vapor-to-particle phenomena inside the soft Xray chamber. Before starting the particle volume size distribution measurement, a fixedMeS vapor concentration was injected into the soft X-ray chamber without turning on thesoft X-rays for a sufficient time to obtain a steady result. After 4 minutes of particle volumesize distribution measurement, the soft X-ray was turned on Figure 2.3 represents the totalparticle concentration and particle size distribution performed with MeS 201 ppbv under asoft X-ray. We divide the particle formation stage as (0) particle-free mode, (1) nucleationmode, (1)+(2) transition mode with nucleation and surface growth, (2) accumulation modewith surface growth and possibly coagulation, and (3) stable mode which is separated bydashed lines, as shown in Figure 2.3. There will also be evaporation of smaller particles byevaporation from the Kelvin effect.
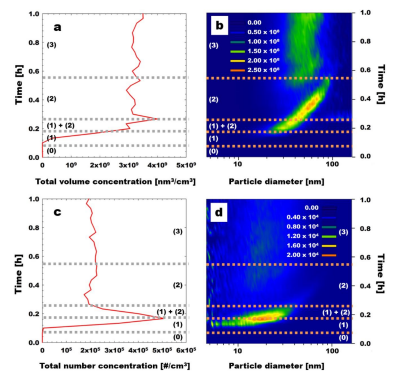
Figure 2.3 Total particle concentration and particle size distribution performed with MeS201 ppbv under soft X-ray: (a) total particle volume concentration; (b) particle volume sizedistribution (nm3/cm3); (c) total particle number concentration; (d) particle number sizedistribution (#/cm3). Dashed lines represent a line separating the stage to explain the changeof particle formation over time. The x-axis in (a), and (c) is the particle concentration, andthe x-axis in (b), and (d) is the particle diameter with a lognormal scale. The y-axis indicatestime. The particle volume and number size distributions are represented as colors in (b),and (d).
Conclusion
In this study, considering the previous experimental results , we found that previous models have the limitation to apply the nanofiber filter media. By applying the slip effect on the nanofiber surface, the airflows across the nanofiber filter media (0.005 ≤ α ≤ 0.100, and 30 ≤ df ≤ 300 nm) were simulated. By slightly modifying Brown’s model, the semi-empirical equation for predicting the pressure drop was developed as follows. Compared to other previous models, We found that our model shows better predictions when compared with the nanofibers' experimental data . Therefore, we expect that the present developed model can be used to analyze the effect of filter parameters including (filter diameter, filter thickness, and solidity) on the pressure drop of nano-size filters as well as micron-size filters.