ABSTRACT
Graphene nanoribbons (GNRs) are atomically precise stripes of graphene with tunable electronic properties, making them promising for room-temperature switching applications like field-effect transistors (FETs). However, challenges persist in GNR processing and characterization, particularly regarding GNR alignment during device integration. In this study, we quantitatively assess the alignment and quality of 9-atom-wide armchair graphene nanoribbons (9-AGNRs) on different substrates using polarized Raman spectroscopy. Our approach incorporates an extended model that describes GNR alignment through a Gaussian distribution of angles. We not only extract the angular distribution of GNRs but also analyze polarization-independent intensity contributions to the Raman signal, providing insights into surface disorder on the growth substrate and after substrate transfer. Our findings reveal that low-coverage samples grown on Au(788) exhibit superior uniaxial alignment compared to high-coverage samples, attributed to preferential growth along step edges, as confirmed by scanning tunneling microscopy (STM). Upon substrate transfer, the alignment of low-coverage samples deteriorates, accompanied by increased surface disorder. For high-coverage samples, the alignment is preserved, and the disorder on the target substrate is reduced compared to the low-coverage samples. Our extended model enables a quantitative description of GNR alignment and quality, facilitating the development of GNR-based nanoelectronic devices.
1. Introduction
Graphene nanoribbons (GNRs) are quasi-one-dimensional stripes of graphene with an intriguing set of physicochemical properties deriving from quantum confinement and related bandgap tunability. The ability to tune the properties of GNRs at the atomic scale by changing their width and edge structure has opened up a promising avenue for their application in electronics, spintronics, and photonics. The required atomic precision in GNR synthesis could only be met by a bottom-up approach based on the covalent coupling of specifically designed precursor molecules followed by cyclodehydrogenation on metallic surfaces. Since the pioneering work of Cai et al. in 2010 , GNRs with various widths, edge topologies (armchair , zigzag, cove , etc.), as well as specific edge extensions giving rise to exotic topological quantum phases, have been reported.
To explore the exciting properties of GNRs in functional devices, a substrate transfer step is necessary to transfer the GNRs from their metallic growth substrate (usually Au(111)) to semiconducting or insulating substrates suitable for digital logic applications, such as SiO2/ Si . Most of the substrate transfer strategies developed so far involve aqueous solutions or the presence of polymers as a support layer, which can lead to residues or defects in the GNRs . To successfully integrate GNRs into devices, GNR properties must be preserved and monitored, also upon substrate transfer, which remains one of the main bottlenecks in the development of GNR-based electronics.
2. Methods
2.1. On-surface synthesis and STM characterization of 9-AGNRs
The Au(788) single crystal growth substrate (MaTecK GmbH, Germany) was cleaned in ultra-high vacuum (UHV) with two cycles of sputtering at1 kV Ar+ for 10 min and annealing at 420 ◦C for 10 min. The 9-AGNR precursor monomer 3′,6′-di-iodine-1,1′:2′,1″-terphenyl (DITP) was then sublimated onto the clean Au surface from a quartz crucible heated to 70 ◦C while the substrate remained at room temperature. A quartz microbalance was used to control the deposition rate of the precursor molecules at 1 Å/min. The deposition rate is not calibrated to correspond to the true surface coverage, but only give a relative measurement that is then calibrated by STM. High- and low-coverage samples were obtained by DITP deposition for 8 and 3 min, respectively. Following deposition, the substrate was heated to 200 ◦C (0.5 K/s) for 10 min to initiate DITP polymerization, followed by annealing at 400 ◦C (0.5 K/s) for 10 min to form the GNRs by cyclodehydrogenation.
2.2. Raman spectroscopy
Raman spectroscopy measurements were obtained using a WITec confocal Raman microscope (WITec Alpha 300R) with a laser line of 785 nm (1.5 eV) and a power of 40 mW. A 50 × microscope objective (0.55 numerical aperture) with a working distance of 9.1 mm was used to focus the laser beam onto the sample and collect the scattered light. Calibration of Raman spectra was performed using the Si peak at 520.5 cm−1 . Also, the laser wavelength, power, and integration time were optimized for each substrate to maximize signal while minimizing sample damage. Furthermore, to avoid sample damage, a Raman mapping approach with 10 × 10 pixels (10 × 10 μm) was used and samples were measured in a home-built vacuum suitcase with pressure ~10− 2 mbar. The vacuum chamber was mounted on a piezo stage for scanning.
3. Results and discussion
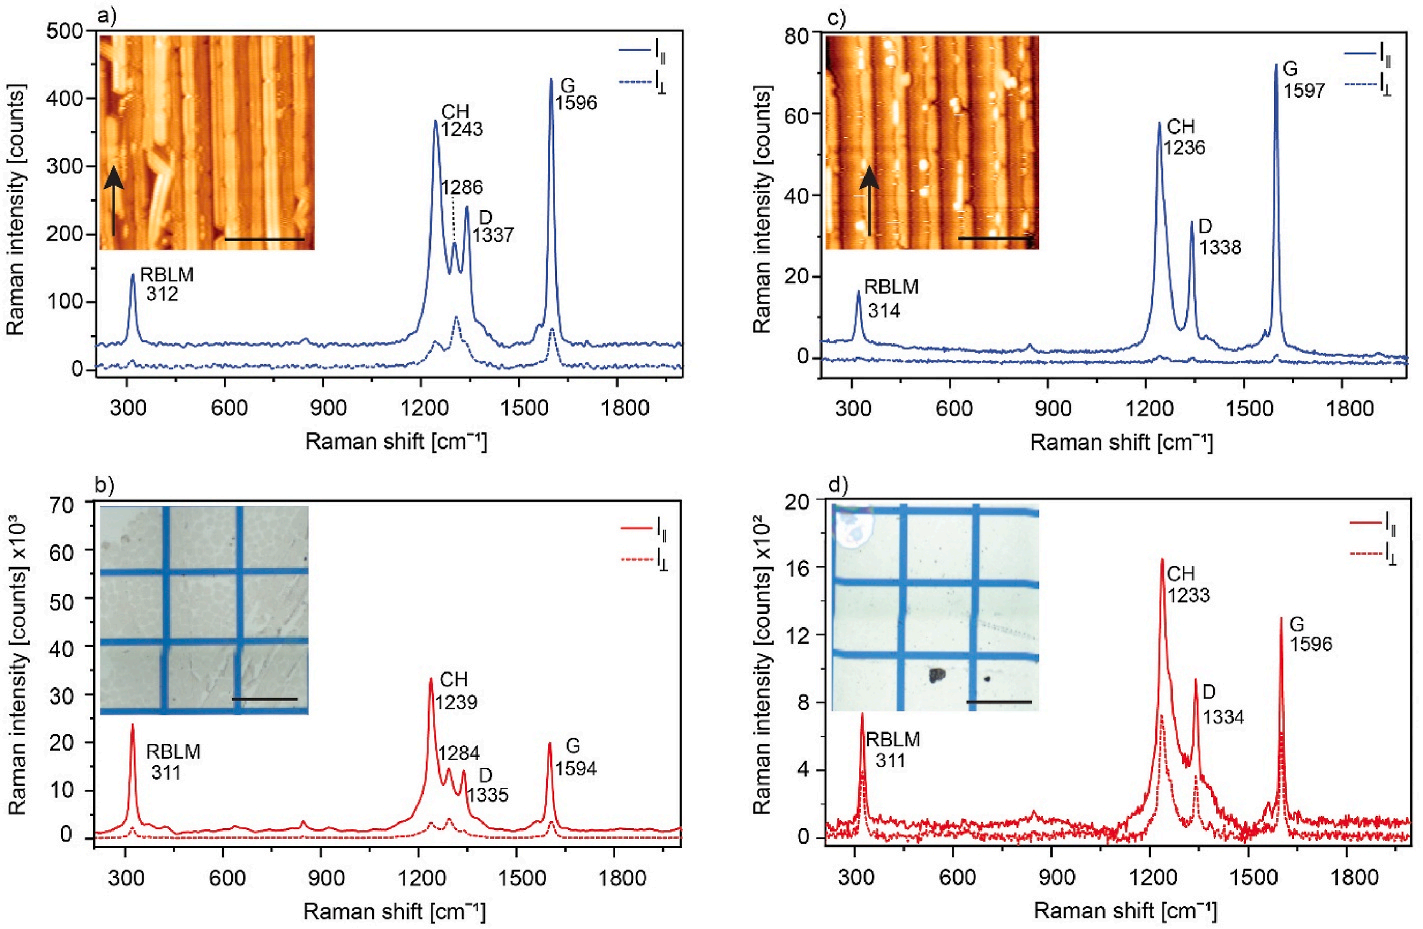
To synthesize aligned 9-AGNRs the precursor monomer 3′,6′-diiodine-1,1′:2′,1″-terphenyl (DITP) is deposited on a vicinal catalytic surface (Au(788)) followed by two annealing steps to activate the polymerization and cyclodehydrogenation reactions. Samples are prepared with two different coverages (~0.4 of a monolayer and ~1 full monolayer, ML, herein referred to as low- and high-coverage samples, respectively) as shown in Fig. 1. The vicinal surface enables the growth of GNRs along the low-coordination sites of the Au(788) step edges, which act as favorable nucleation sites. This allows GNRs to grow gradually with deposition time, and after 8 min with a fixed deposition rate of 1 Å/min, a full monolayer of aligned 9-AGNRs (high-coverage sample) is formed. A representative STM image of a high-coverage sample with 9-AGNRs of an average length of 34 nm is shown in Fig. 1a, the corresponding GNR length histogram is given in Fig. S1a. For the low-coverage 9-AGNR samples, a deposition time of 3 min is used (with a fixed deposition rate of 1 Å/min), which provides just enough precursor molecules for individual 9-AGNRs to grow along all Au(788) step edges, resulting in an average GNR length of 37 nm (Fig. 1c, see Fig. S1b for the length histogram).

Fig. 1. Characterization of aligned 9-AGNRs samples at high (a,b) and low (c,d) coverage before (a,c, blue spectra) and after (b,d, red spectra) substrate transfer. Raman spectra of the high-coverage sample on Au(788) (a) and after substrate transfer onto a Raman-optimized substrate (ROS)(b). The spectra are acquired with an excitation wavelength of 785 nm under vacuum conditions with polarization parallel (I‖) to the GNR alignment direction (along the Au(788) step edges) (full line), and perpendicular (I⊥) to the GNR alignment direction (dashed line). The inset in panel (a) shows a STM topography image for the high-coverage sample on Au (788) (black arrow highlighting the GNR growth direction and position) with a scale bar of 10 nm (Vb = -1.5 V, It = 0.3 nA). The inset in panel (b) shows an optical micrograph of ribbons transferred onto a ROS, with a scale bar of 180 μm. Raman spectra of the low-coverage sample (c) on Au(788), and (d) after substrate transfer onto a ROS, with polarizations/full vs dashed lines as indicated above. The inset in panel (c) shows a STM image for the low-coverage sample on Au(788), with a black arrow highlighting the GNR growth direction and position along the Au(788) step edges of (Vb = -1.5 V, It = 0.3 nA, scale bar: 10 nm). The inset in panel (d) shows an optical micrograph of GNRs transferred onto a ROS, with a scale bar of 180 μm. All Raman spectra show four main modes: RBLM (width-dependent mode), CH (C–H bending mode at the edges), D (breathing mode of the sp2 lattice) and G (stretching of C–C bonds within the sp2 lattice).
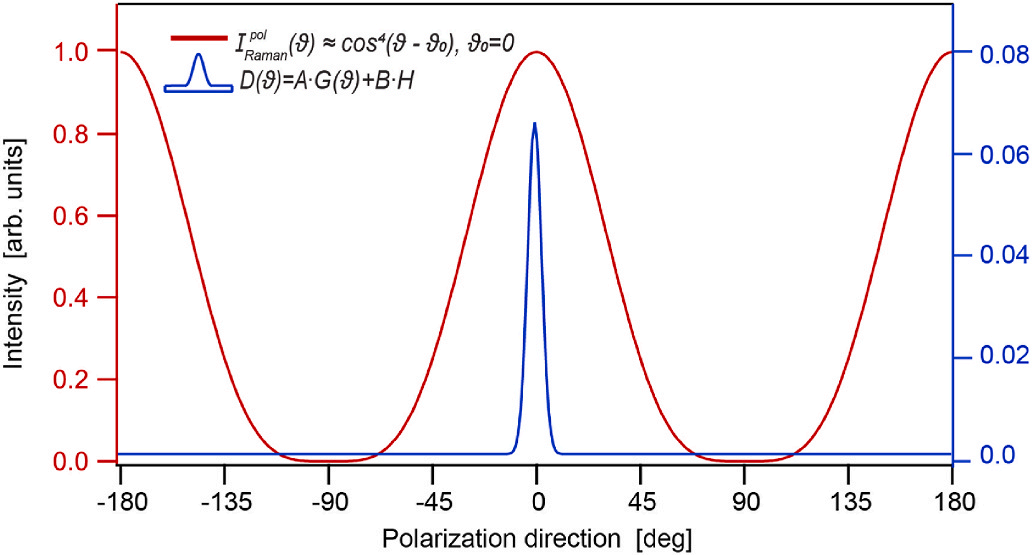
Raman profiles are obtained by polarizing the incoming and scattered light in parallel (“VV configuration”) with different angles between the nominal GNR alignment direction and the polarization of the incident light. Using the VV configuration implies that for the Raman resonant modes, the intensity of the GNR modes is projected to be cos4 (ϑ) polarization-dependent, which results from a product of two cos2 (ϑ) factors, one for photon absorption and the other for photon emission, Eq. (1) . This means that the Raman signal is maximum with the incident polarization parallel to the ribbon axis (0◦, 180◦) and zero when perpendicular to it (90◦, 270◦) (Fig. 2). In Eq. (1), ϑ0 is the orientation of the long axis of the GNR with respect to an arbitrary in-plane axis, and ϑ is the direction of the light polarization. Due to the significant absorption anisotropy of the quasi-1D GNRs, all Raman modes exhibit roughly the same polarization dependency.

Fig. 2. Illustration of the major contributions to the expected polarized Raman intensity as described by Eq.. The Raman intensity of a single GNR follows cos4 (ϑ) dependence (red). In blue, the angular distribution function D(ϑ) is shown, which includes the normalized Gaussian distribution of angles and the normalized isotropic contribution. For this particular plot, σ = 3◦, A = 0.5, and B = 0.5 have been used.
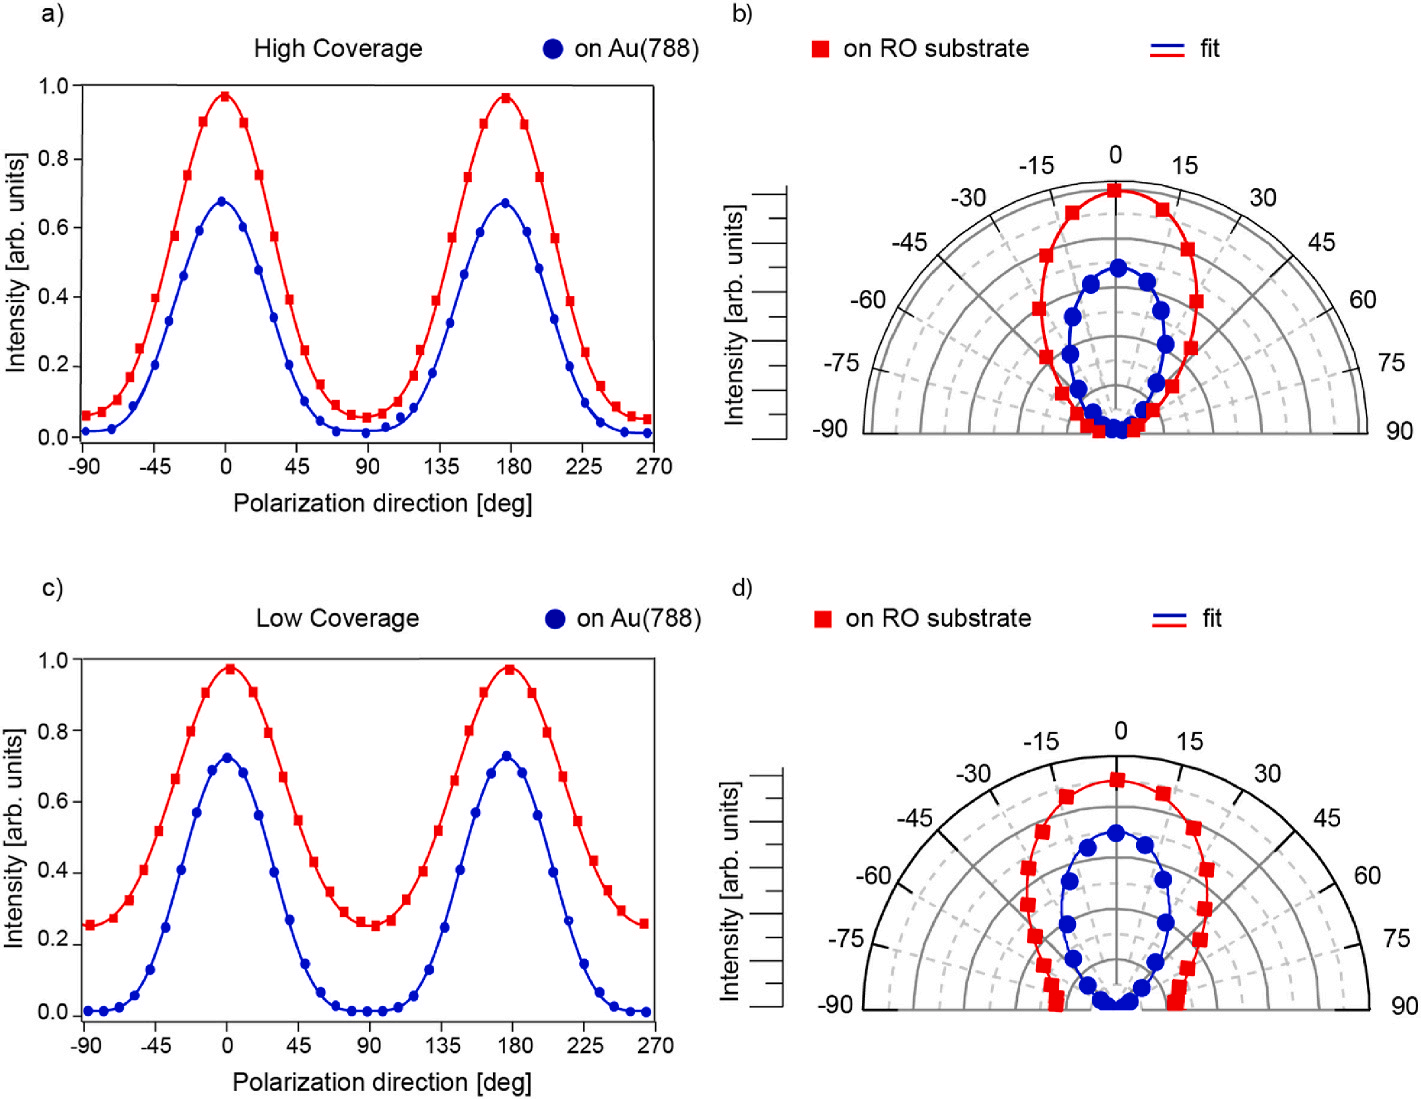
To investigate the influence of GNR coverage and substrate transfer on σ and OD, we fit all Raman active modes of high- and low-coverage 9- AGNR samples on both the growth and ROS using Eq. (9). Fig. 3 shows the G mode peak intensity as a function of the polarization angle ϑ for the VV configuration and the related polar diagrams for both high- (Fig. 3a–b) and low-coverage samples (Fig. 3c–d) on Au(788) (in blue) and after substrate transfer (in red), respectively (see Figs. S4 and S5 for similar plots for CH, D, and RBLM modes). The intensity of the G mode as a function of polarization angle (− 90◦ to +90◦) is determined from Raman maps of 10 x 10 pixels in vacuum conditions using a 785 nm laser energy.

Fig. 3. Polarized Raman intensity of G mode (785 nm, VV configuration). (a, c) G mode intensity as a function of polarization angle ϑ for high- and low-coverage samples on Au(788) (blue circles) and after substrate transfer onto ROS (red squares). Blue and red solid lines represent data fits using Eq. (9). (b, d) Polar diagrams showing G mode intensities for high- and low-coverage samples on Au(788) (blue circles) and after transfer to ROS (red squares). Blue and red solid lines represent fits to the measured data using Eq. (9).
On the Au(788) growth substrate we observe a similar OD for both high- and low-coverage samples (8 %). The disorder observed on the growth substrate may originate from short (and thus non-aligned) GNRs, irregularly fused precursor monomers, or also the presence of impurities from the precursor monomer.
4. Conclusions
In this study, we employed polarized Raman spectroscopy and scanning tunneling microscopy to characterize and quantify the structural quality and degree of alignment of 9-AGNRs in samples with different surface coverages on both their growth substrate and after substrate transfer. Using an extended data analysis model, which describes GNR alignment by a Gaussian distribution of angles, allowed us to extract both the quality of alignment (σ) and the overall surface disorder (OD).
Our results show that low-coverage samples exhibit better uniaxial alignment than high-coverage samples on the growth substrate. This behavior results from GNRs in low-coverage samples growing preferentially along the step-edges of Au(788), as observed in our STM investigations. However, upon transfer, the quality of alignment of lowcoverage samples is significantly reduced, which we attribute mostly to the strong interaction of GNRs with the Au(788) step edges as well as increased GNR mobility, whereas high-coverage samples show better alignment preservation upon substrate transfer, owing to the densely packed GNR film facilitating the transfer process. With the extended model developed in this study, we also quantified the OD, which results in an isotropic (polarization-independent) contribution to the Raman intensity. After substrate transfer, low-coverage samples show systematically higher OD values than high-coverage samples (39 % vs 13 % respectively). The significantly higher OD for low-coverage samples is associated with the strong interaction of GNRs to the Au(788) step edges, making it less likely for the GNRs to transfer efficiently, as well as to the fact that more gold surface area is exposed to PMMA and other impurities that may react with the metal and transfer along with the GNRs to the target substrate. Based on these findings, strategies to improve GNR alignment and quality are needed. One approach could be the passivation of Au(788) step edges with other materials, such as wide bandgap polymers. The presence of a polymer at the step edges could simultaneously decrease the strong interaction between GNR-Au and act as a scaffold, mitigating GNR’s lateral diffusion and preserving GNR alignment throughout the substrate transfer process.
上一篇: 低温下在硅晶圆上单步碳化硅异质外延