ABSTRACT
The coalescence phenomenon of air bubbles affects the flow field, bubble morphology, bubble velocity, and mass transfer efficiency in bioreactors, air bubble generators, and other devices. This article combines the level set method with COMSOL to simulate the formation process of two-phase fluid bubbles in microfluidic chips. The result shows that when the contact angle exceeds 90○ , significant agglomeration occurs and the size of bubbles decreases with the increase in liquid flow velocity. However, as the gas velocity increases, agglomeration does not occur at liquid flow rates below 0.1 m/s. In addition, the agglomeration phenomenon occurs above the threshold, and when the gas flow rate is less than 0.02 m/s, there is no agglomeration phenomenon. The numerical simulation results exhibit an error rate of less than 10% compared to the experimental values, indicating that microfluidic chips can accurately predict the process of bubble coalescence.
I. INTRODUCTION
In our daily lives, interactions between multiple bubbles happen every day. When there are two or more bubbles in the environment, one bubble will alter the ambient pressure of another bubble, affecting its dynamics and increasing its oscillation period, resulting in a coalescence phenomenon.Bubble coalescence significantly affects the flow fields, bubble shapes, bubble velocities, and mass transfer efficiency, impacting various processes, such as mass and heat transfer in bioreactors, the performance of bubble generators, and other devices. Microfluidic technology is a recent development on microfluidic chips that aims to study microbubbles’ generation, manipulation, and application within microns.5–8 With the introduction of micro-electro-mechanical systems (MEMS), attention has been drawn toward bubble coalescence caused by gas–liquid two-phase flow in microchannels of microfluidic chips.
After formation in a microfluidic device, microbubbles continue to move within the flow field. However, during this movement process, they collide with and interact with the surrounding fluids, leading to their coalescence. Due to the rapid nature of this process, early theories on bubble coalescence were based only on droplet coalescence studies. Most researchers initially explored factors influencing single bubble formation. Hamid Reza, Ghorbani, and other scholars used numerical simulation methods and experiments to investigate these influencing factors as well as describe the mechanism behind gas–liquid two-phase flow interaction for bubble formation. Chen and other scholars established a T-type microchannel simulation model, where they conducted numerical simulations on Newtonian and non-Newtonian fluid environments for studying factors such as microchannel size and the influence of liquid viscous force on bubble formation.
II. EXPERIMENT
While preparing the microfluidic chip, polydimethylsiloxane (PDMS) material was mainly chosen, and the microchannel structure was engraved on PDMS by photolithography, as shown in Fig. 1. The specific preparation process is as follows: AutoCAD software was used to draw the chip graphics, and a high resolution laser phototypesetter was used to produce the lithographic mask on the photographic plate. A glass substrate of appropriate size was selected. A magnetron sputtering machine was used to coat the cleaned glass substrate with chromium film, and then an RZJ-340 positive photoresist was evenly coated on the surface. After predrying, exposure, and development, the glass sheet is immersed in a chromium etching solution for etching, and the adhesion of the photoresist and sacrifice layer is improved by hardening the film. Then the treated glass sheet is immersed in another etching solution containing HF and HNO3 for wet etching. After the prepolymer Sylgard184 and curing agent were evenly mixed in a mass ratio of 10:1 and the bubbles were removed, the PDMS cover sheet could be obtained by curing at 75℃ A hole punch is used to punch the glass cover plate, and a glass–PDMS microfluidic chip is prepared by quickly bonding the cover and substrate after being treated by air plasma.
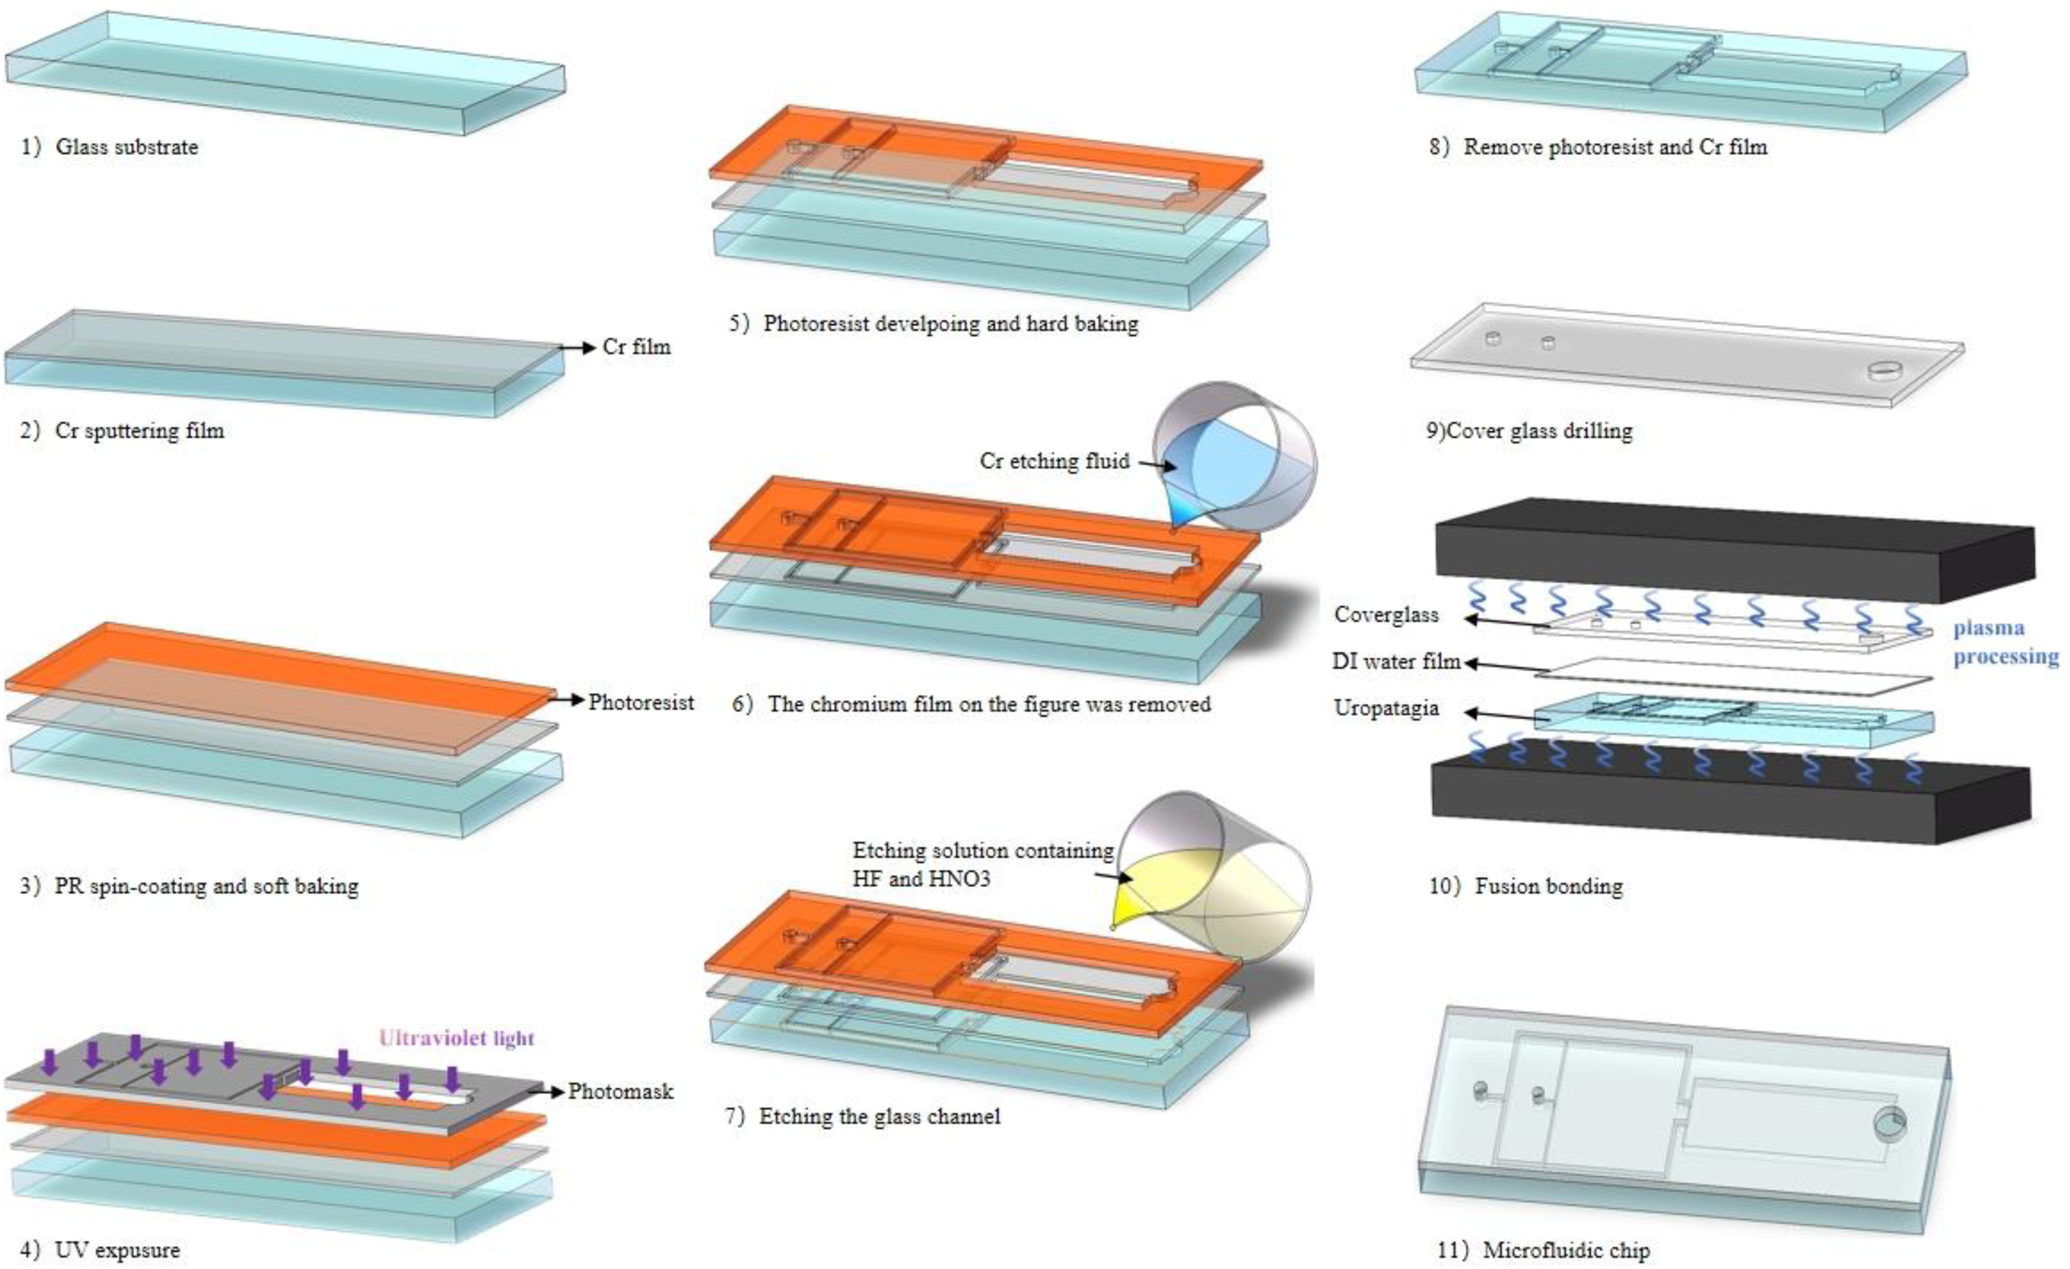
FIG. 1. The fabrication process of the PMDS microfluidic chip.
The specific form of the microfluidic chip is shown in Fig. 2. The chip includes a gas inlet, a liquid inlet, a bubble-forming zone, a bubble agglomeration zone, and an outlet for the gas–liquid mixture. The total length of the chip is 66 mm, the entire width is 18 mm, the depth of all microchannels is 0.1 mm, the width of the liquid channels is 0.5 mm, and the width of the gas channels is 0.15 mm. The two gas-liquid phases flow into the microchannel from their respective inlets and converge at the T-shaped microchannel after splitting, generate microbubbles through flow shear, and finally flow into the bubble convergence zone. The bubble convergence phenomenon in the system area is observed through high-speed microscopy.
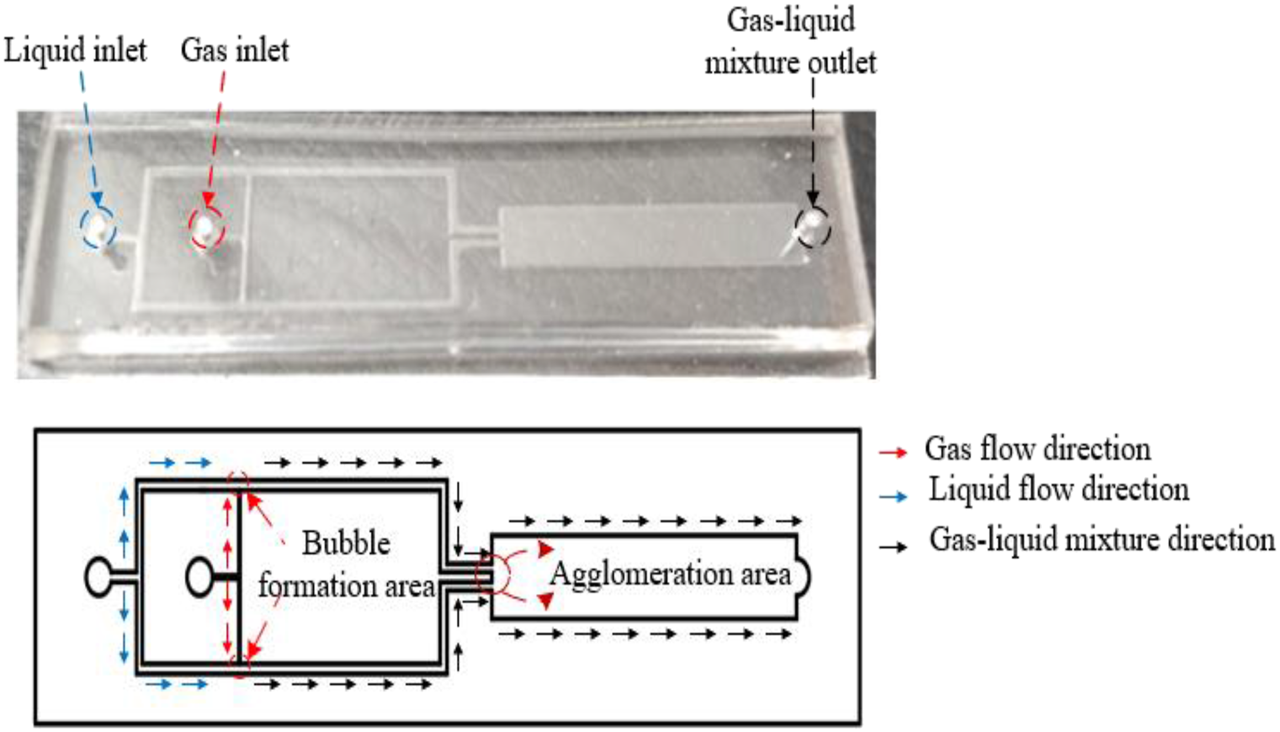
FIG. 2. Physical structure of the microfluidic chip.
The PDMS microfluidic chip is used as a carrier to build a complete test system for observing the aggregation of microbubbles, and the microbubble bubble aggregation test system is shown in Fig. 3.
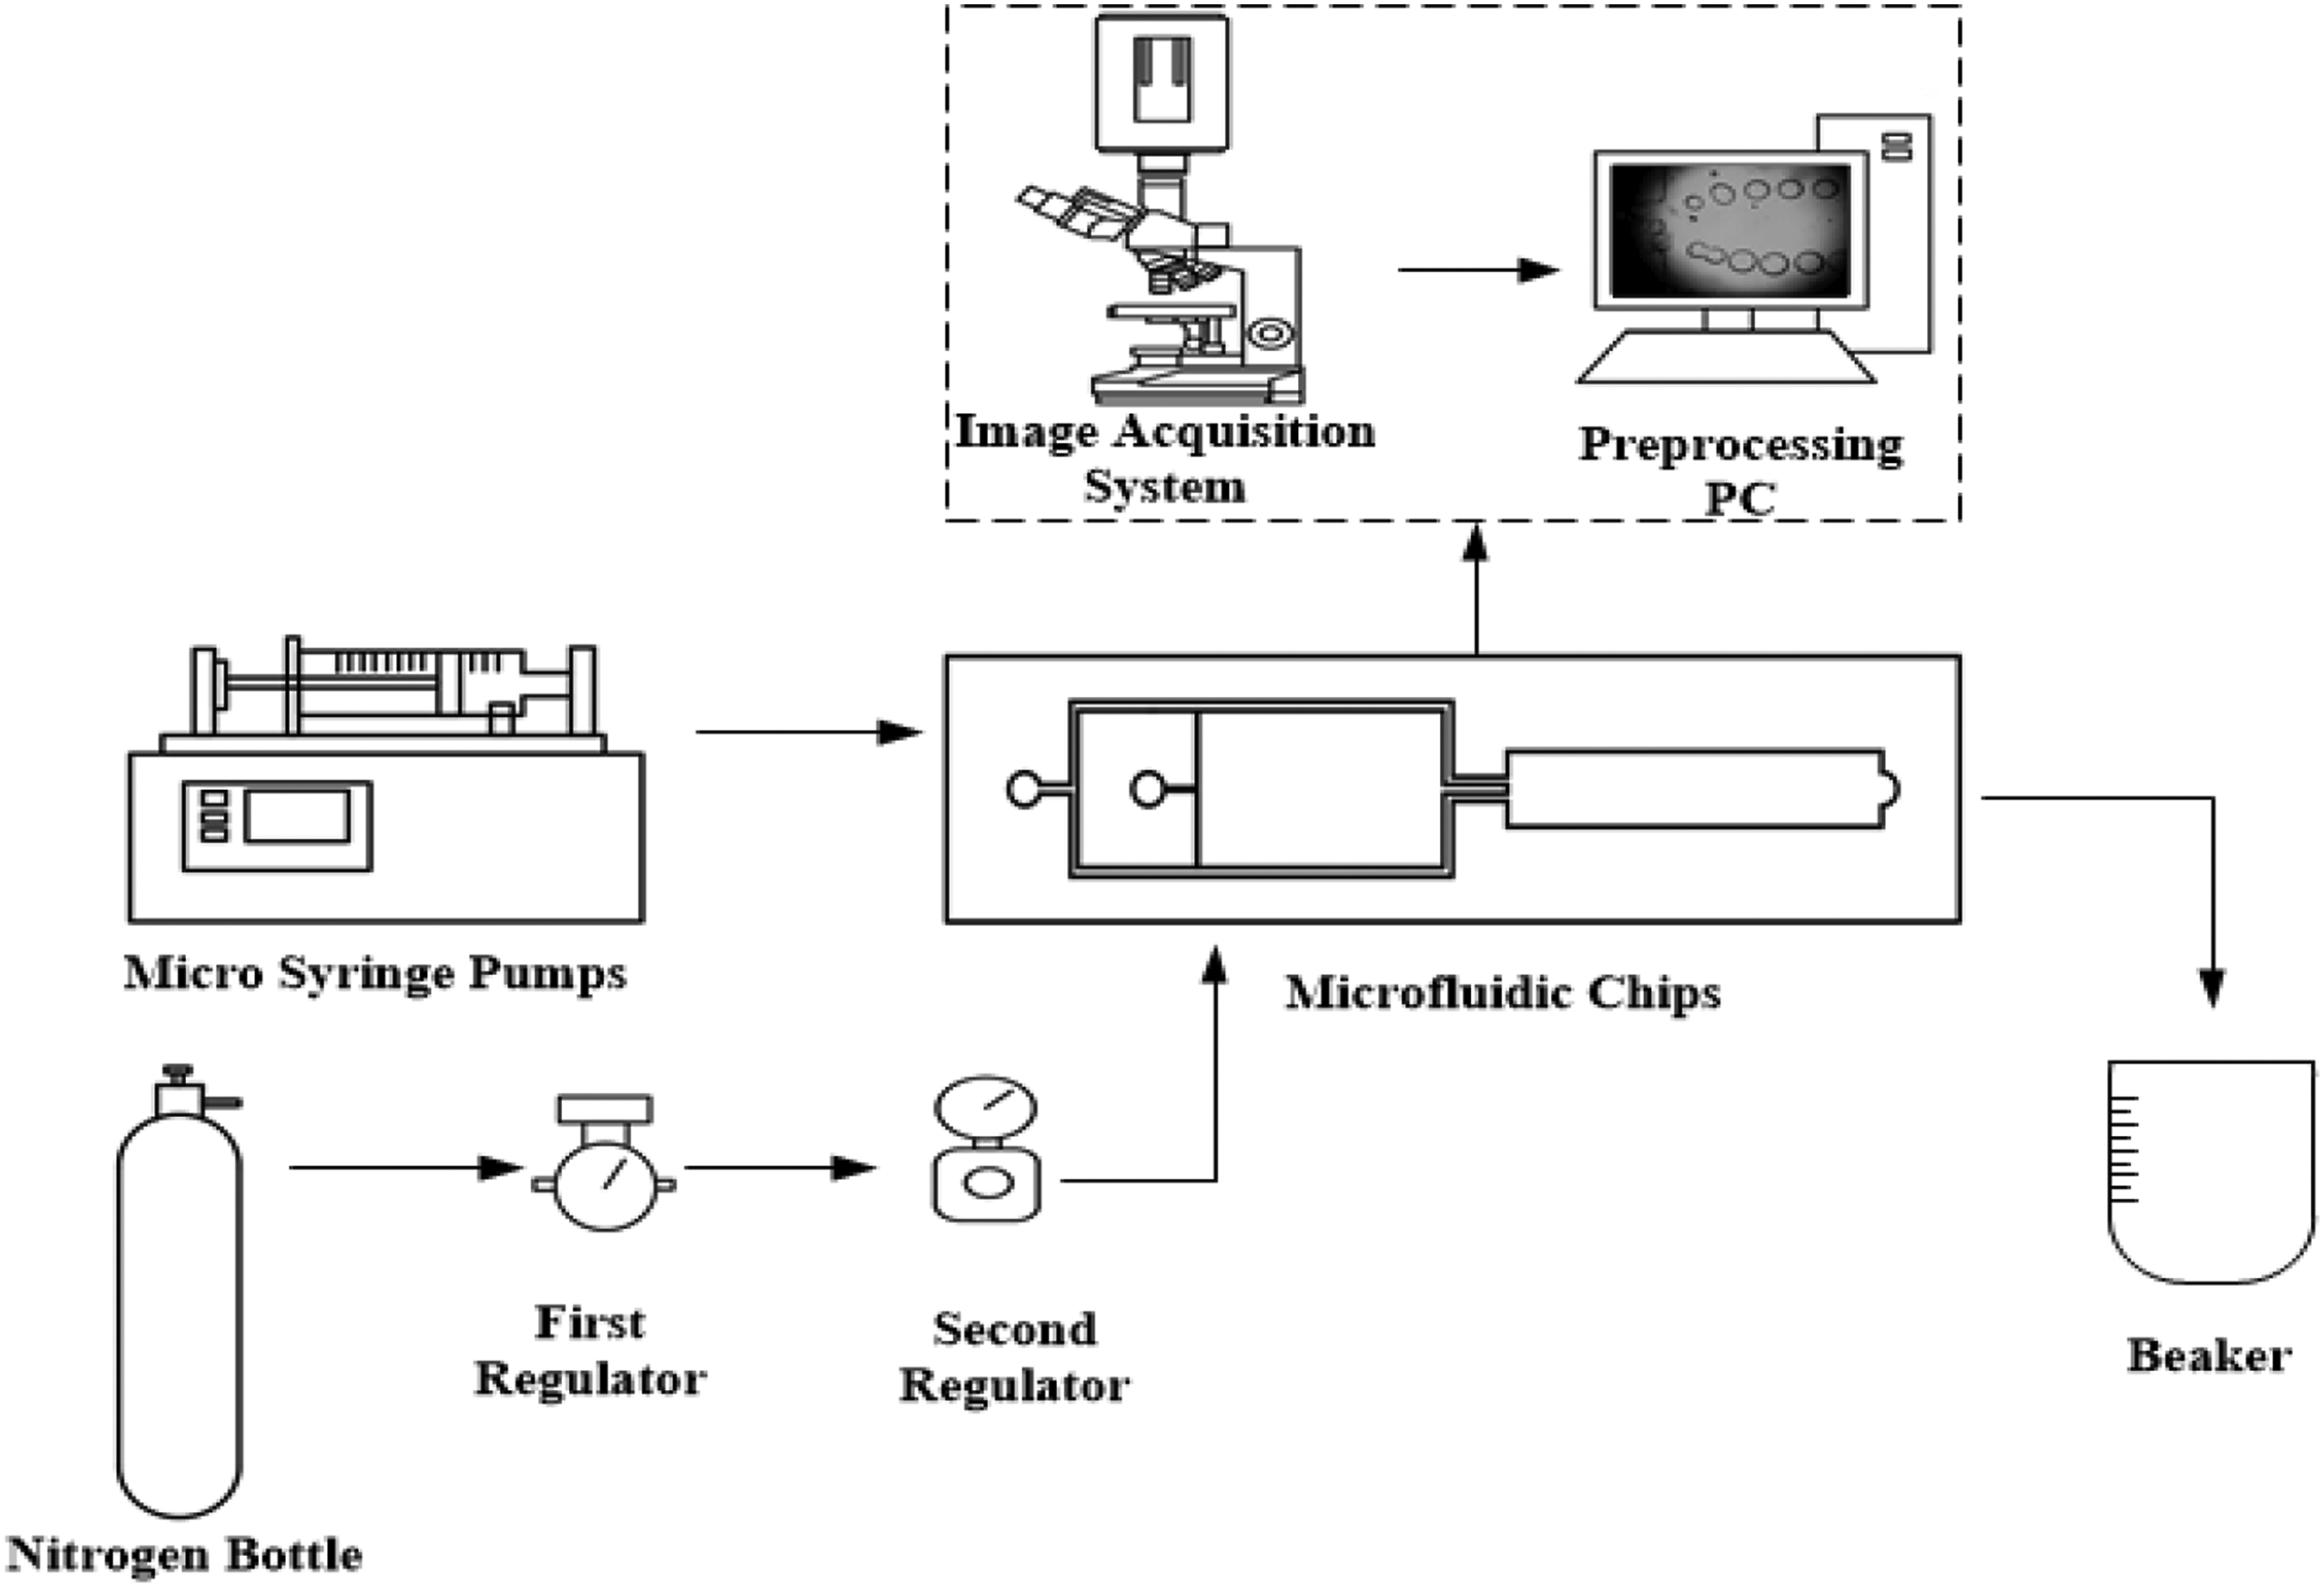
FIG. 3. Schematic diagram of the experiment system.
III. NUMERICAL APPROACH
Based on the actual dimensions of the microfluidic chip, the geometric model of the microfluidic chip in the numerical simulation is constructed. As shown in Fig. 4(a), the gas channel width is a = 0.15 mm, the liquid channel width is b = 0.5 mm, and the gas mixture outlet width is e = 2.5 mm, all at a depth of 0.05 mm. As shown in Fig. 4(b), during the simulation, the gas enters the gas channel A from the gas inlet, and the liquid enters the liquid channel B from the fluid inlet; then these pass through the gas–liquid mixing channel and finally exit through the gas–liquid mixture outlet.
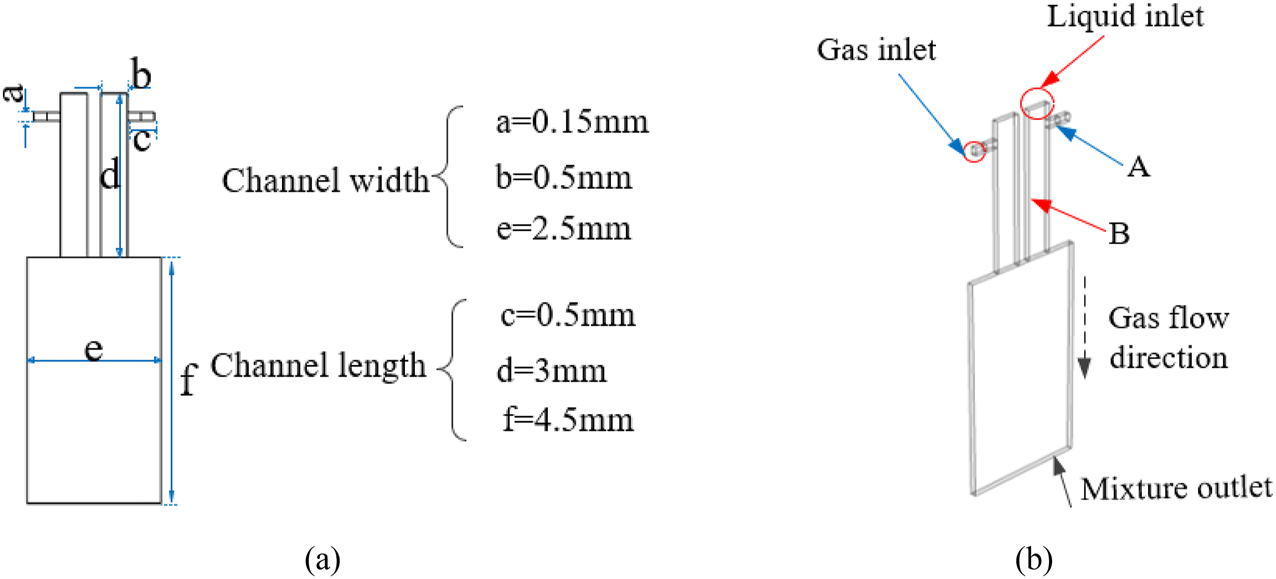
FIG. 4. Numerical analog chip. (a) Dimensional drawing; (b) structural drawing.
To observe the variation in the equivalent diameter before and after the bubble aggregation in the double T-shaped microchannel under different working conditions, numerical simulations of the bubble aggregation effect under different contact angles were carried out to analyze the impact of contact angle on the aggregation of microfine bubbles by controlling the variable method with a fixed liquid flow rate of 0.25 m/s and a gas flow rate of 0.05 m/s. As can be seen from Fig. 6, when the contact angle is less than 90○ , the fine bubbles merge, but the merged bubbles do not maintain a regular shape and continue to flow. When the contact angle is greater than 90○ , the microscopic bubbles are agglomerated, and the agglomerated bubbles can maintain a particular regular shape and continue to flow forward.
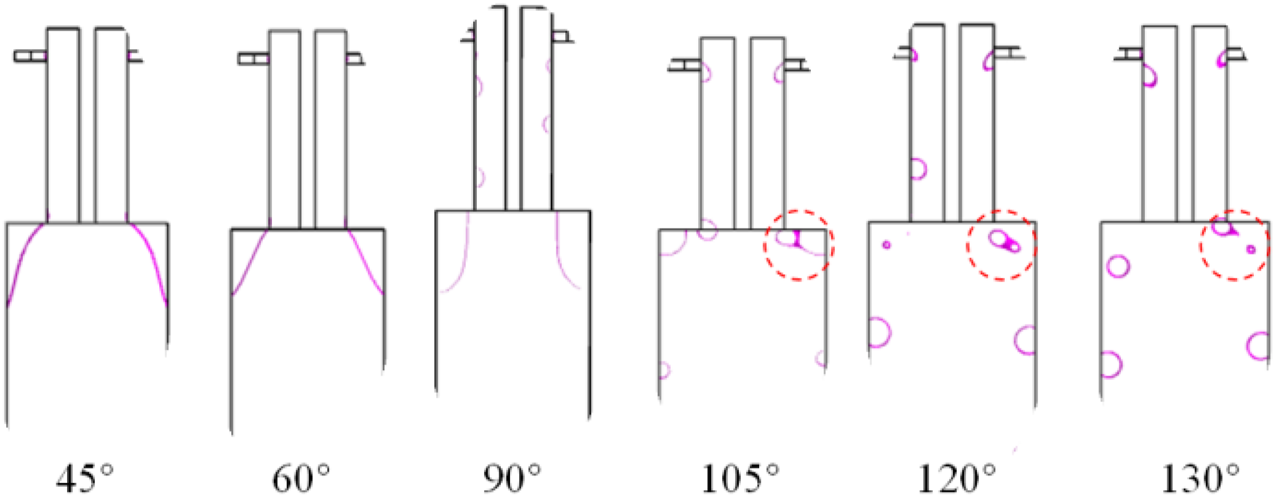
FIG. 6. Effect of contact angle on the aggregation of fine bubbles.
Figure 7 shows the variation in the equivalent diameter of the bubble before and after aggregation with an increasing liquid flow rate at a fixed gas flow rate. The dots did not merge when the fluid flow rate was less than 0.1 m/s and merged when it was more significant than 0.1 m/s. The equivalent diameter of the bubbles after aggregation was more critical than that before collection at different liquid flow rates, and the diameter of the bubbles before and after accumulation decreased with the increase in the liquid flow rate. The shape of the bubbles before and after aggregation can be seen in Figs. 7(a), 7(b), 7(a′ ), and 7(b′ ), where the bubble diameter after collection is less than twice the diameter before aggregation.
Figure 8 shows the variation in the equivalent diameter of the bubbles before and after aggregation with an increasing gas flow rate for a fixed liquid flow rate. The bubbles did not merge when the gas flow rate was less than 0.02 m/s but merged when the gas flow rate was more significant than 0.02 m/s. The equivalent diameter of the bubbles was more significant than that of the bubbles before and after the merging at different gas velocities, and the diameter of the bubbles before and after the merging increased with the increase in the gas velocity. The bubble diameters before and after aggregation can be seen in Figs. 8(a), 8(b), 8(a′ ), and 8(b′ ), where the post-aggregation bubble diameter is less than twice the diameter of the pre-aggregation bubble.
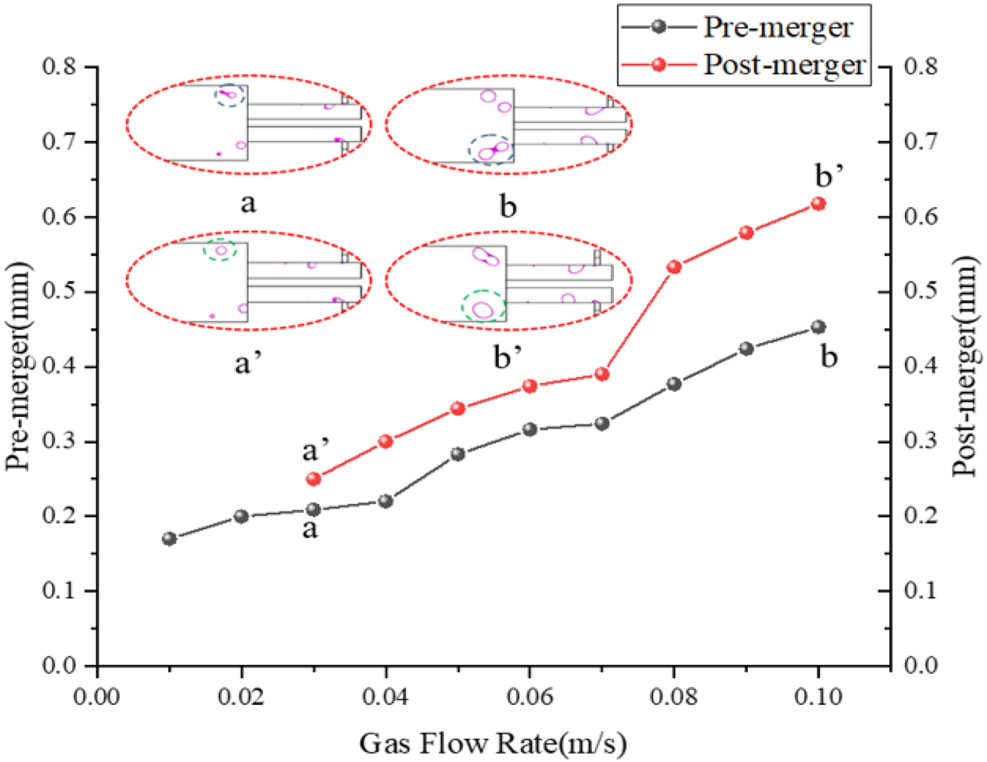
FIG. 8. Influence of gas flow rate on the aggregation of fine bubbles.
To observe the clustering of bubbles in the microfluidic chip with double T-shaped microchannels, a 200 ml glucose solution with a mass fraction of 10% was prepared to keep the clustering of bubbles at different liquid and gas flow rates. The experimental results showed that within the adjustable liquid and gas flow rates, the bubbles flowing from the two parallel microchannels first disperse at a fixed angle to both sides of the microchannels in a “figure of eight” shape, and after expanding to a certain distance, the bubble flow lines on both sides are approximately parallel. The bubbles flow forward at equal speed. In the transition process from the discrete expansion phase to a similar flow phase, the bubbles flowing serially on both sides of the microchannel will be merged, as shown in Fig. 9. Comparison of the numerical simulation results with the experimental results reveals the same trend.
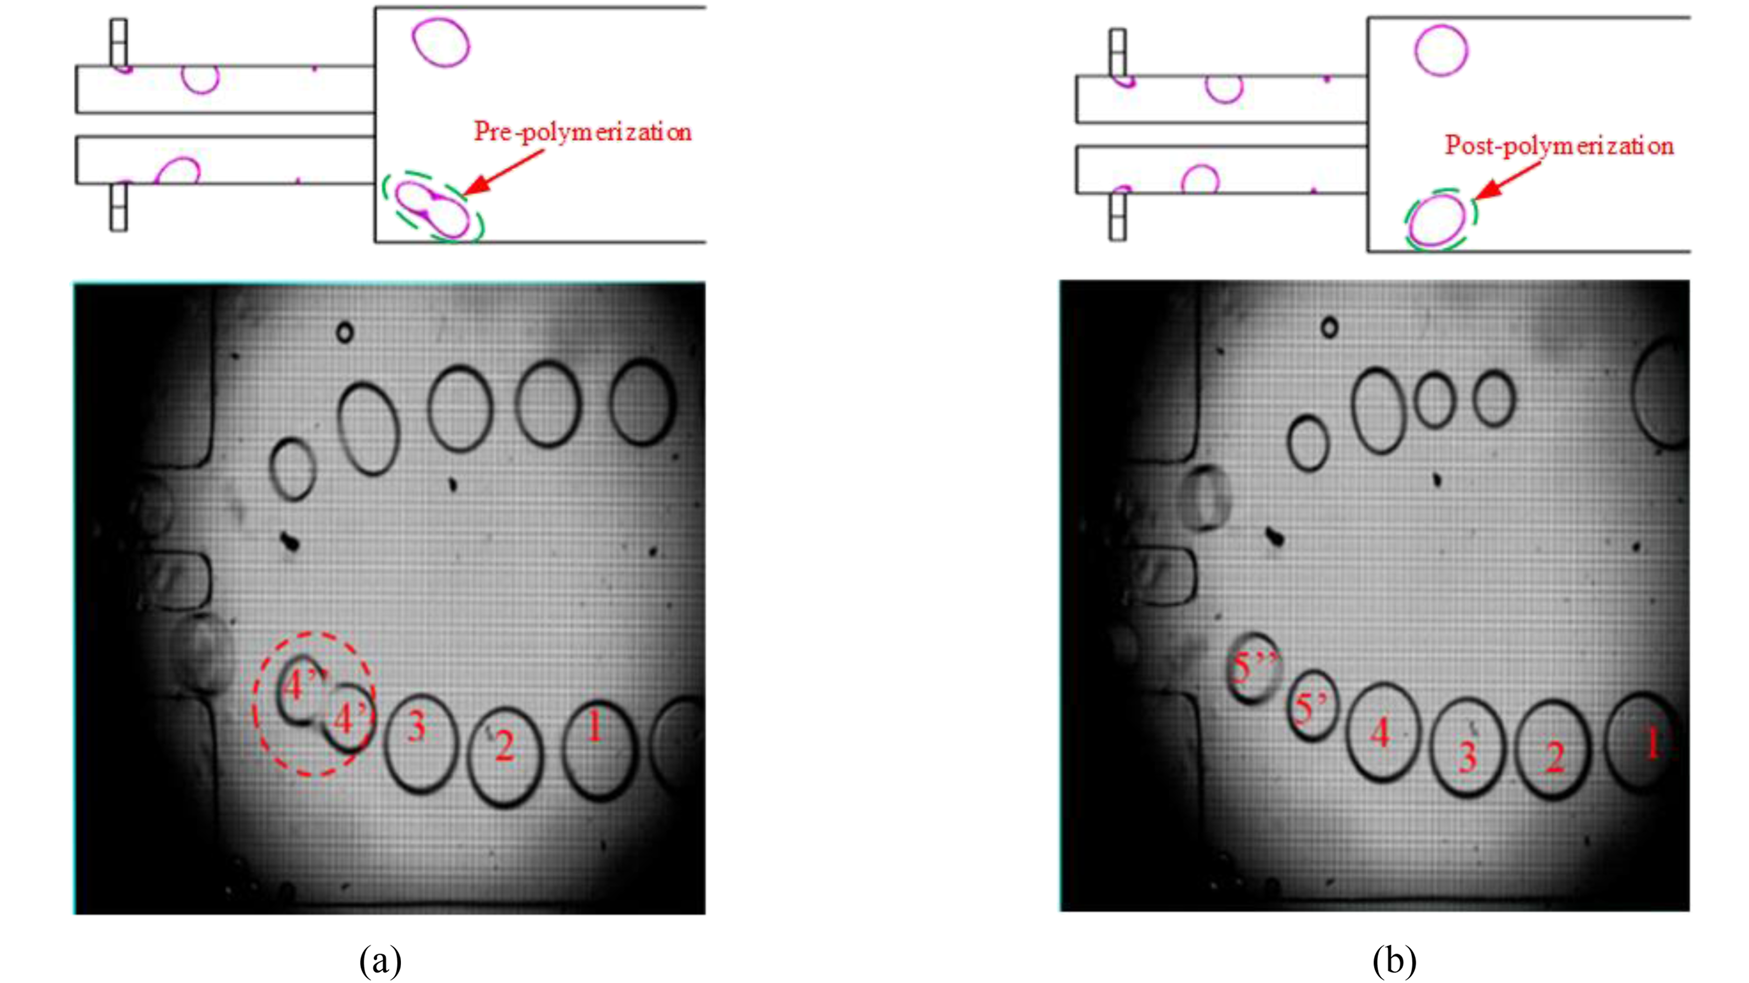
FIG. 9
In this paper, an experimental system for observing the aggregation of fine bubbles was established based on a double-T microfluidic chip, and numerical simulations of the aggregation process of fine bubbles were carried out to investigate the effects of different contact angles, liquid flow rates, and gas flow rates on the aggregation of bubbles, and the following conclusions were reached: (1) When the contact angle is less than 90○ , although the microbubbles are aggregated, the aggregated bubbles cannot maintain a particular regular shape and continue to flow forward. When the contact angle is greater than 90○ , fine bubbles occur together, and the bubbles can maintain a particular regular shape to continue to flow forward. (2) A liquid flow rate of less than 0.1 m/s did not occur when aggregation was more than 0.1 m/s. In different liquid flow velocity environments, the equivalent diameter of the bubble after collection is more significant than before assembly. The simulated and experimental values describe the same pattern, the size of the bubbles before and after aggregation increases with the increase in the gas flow rate. The deviation between the simulated and experimental values is less than ±10%. (3) The gas flow rate was less than 0.02 m/s, but the bubbles did not merge when the gas flow rate was more significant than 0.02 m/s. The equivalent diameter of the bubbles after aggregation was more critical than that before collection at different gas flow rates. The simulated and experimental values describe the same pattern: the size of the bubbles decreases before and after aggregation with the increase in the liquid flow rate. The deviation between the simulated and experimental values is less than ±10%.
下一篇: 石英晶体的蚀刻:综述