Introduction
It has been well established that single wafer cleaning tools can achieve reduced cycle times and improved cleaning performance relative to batch tools. Recently, a unique immersion-based single wafer processor, the EmersionTM, was shown to achieve damage-free megasonic cleaning of sub-50 nm device structures with a corresponding high particle removal efficiency (PRE) [1]. In this paper, we investigate the mechanisms of cleaning and damage-free processing with the Emersion multiple transducer chamber. We present particle removal efficiency, sonoluminescence imaging data, and megasonics damage results for a wide range of operating conditions. These results are used to propose a model for the operation of the multiple transducers in the chamber.
Megasonics Transducer Configuration in Emersion Chamber
The Emersion single wafer chamber utilizes a unique configuration of three megasonic transducers. A key design objective was to take advantage of the exposure of the entire wafer surface, allowing for the application of multiple acoustic wavefronts to the wafer. It was expected that the combined action of these wavefronts would allow for the use of reduced megasonics power levels and reduced process times to eliminate damage without sacrificing cleaning. The schematic shown in Fig. 1 shows the incorporation of three transducers into the processing chamber. The bottom transducer is similar in function to batch transducers. The front transducer introduces an oblique angle acoustic wavefront to the front(device) side of the wafer, while the back transducer introduces a similar wavefront to the backside of the wafer. The wafer is lifted via vertical sweeps, in order to completely pass through the upper transducer wavefronts multiple times. During processing, the bottom transducer is on during the entire process time of 30 seconds. Since the upper transducers are turned on only during the sweep sequences, the exposure time of any die on the wafer to the megasonics power is limited to milliseconds, thereby minimizing damage.
PRE Testing and Results
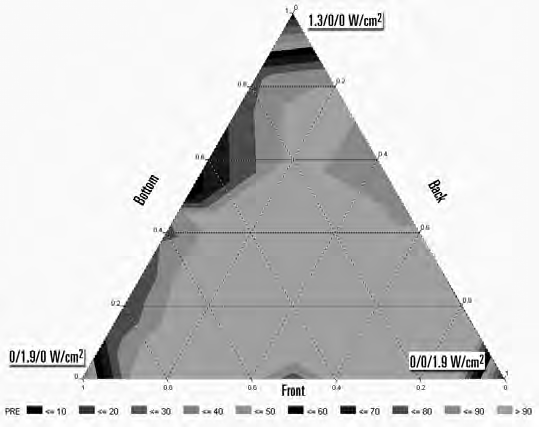
Fig. 2 summarizes results of a full factorial design of experiments which investigated the effects of transducer configuration and power level on particle removal efficiency. PRE tests were conducted using a 30 second dilute SC1 process on aged Si3N4 challenge wafers deposited by wet adsorption. The ternary plot shows a well defined center region where high PRE values are realized. Many of the data points within this region were achieved using surprisingly low megasonics power levels on the multiple transducers(eg. <0.3 W/cm2 ). Table 1 summarizes the effect of configuration and total power on the PRE showing that the configuration of the transducers is more important than the total power applied. The lowest total power case produced a much higher PRE than the highest total power case. The ability to achieve PRE values >95% using a dilute SC1 solution with a process time of only 30 seconds is unusual, given that traditional SC1 cleaning mechanisms rely upon etching and undercuttingof particles. Therefore, the transducer interactions are playing a major role.

The PRE results described above suggested that some unusual acoustic effects were occurring in the chamber. The most likely explanation was thought to be cavitation events and possible Lamb wave generation. In order to provide a direct indication of these phenomena, sonoluminescence imaging was performed. Sonoluminescence refers to the photon emission that occurs when a collapsing cavitation bubble heats the gas within to temperatures that are high enough to generate incandescent light. In these tests an optical imaging system was mounted on top of the Emersion chamber to quantitatively measure sonoluminescence within the chamber, as shown in Fig. 3a. Several combinations of transducer configuration and power were investigated. Figure 3b shows a typical light intensity distribution looking down into the chamber. In this image, the front and bottom transducers were each powered to a value of <1W/cm2 . The dark region corresponds to the wafer interior and backside. The large bright spots are due to the collapse of large gas bubbles in the off-site test stand that did not use degassed DI water. The same data is plotted in Fig. 3c in 3-d form. It is evident that the cavitation reaches a maximum at the wafer front surface. Similar data for other configurations and power levels is summarized in Fig. 4. This curve shows the photon intensity profile along the axis between the two transducers, with the wafer front surface located at X= - 0.2cm. The notation for the power densities is “bottom /front /back”. It is evident from these results that the front and back transducers play a dominant role in increasing the cavitation. The flat line curve at low bottom power was used to demonstrate the signal to noise ratio. The case with high power applied to the back transducer(0/0/1.9 W/cm2 ) gave an unusual, but not unexpected result, as shown in Fig. 3d and Fig. 4. The expected large number of cavitation events at the wafer backside is clearly seen. However, it is important to note the high level of cavitation on the front side of the wafer. Previous studies have implicated the presence, and the damaging effects, of Lamb waves when backside transducers are used in single wafer spin systems [2]. However, this is the first reported case of acoustic cavitation caused by the use of backside megasonics. This explains the high PRE for this case. The low power condition with all three transducers firing at 0.2W/cm2 showed a very uniform cavitation profile, which gave a high PRE of 92%.
下一篇: 半导体湿式蚀刻和表面制备的工业背景