Experimental
All experiments were carried out under controlled quasiisothermal conditions by using a cryostat Polystat K12-2, Huber Kältemaschinen GmbH, Offenburg, Germany . Wide-mouthed bottles of HDPE high-density polyethylene or of PFA perlflfluoroalkoxyalkane were taken as reaction vessels. The reaction vessels were screwed into a sample holder with a maximum of four vessels at the same time. HF–HNO3-acid mixtures with a composition of 70% v/v HF and 30% v/v HNO3 were prepared from analytical grade acids HF 40% w/w , nitric acid 65% w/w , Merck, Darmstadt, Germany . A volume of 50 mL of this mixture was fifilled in the respective sample vessel and thermostatted to the reaction temperature.
In order to prepare etch mixtures with a defifined silicon content m Si diss. , pieces of p-conducting silicon diameter 4 in., polished, thickness 675 m, resistivity 24–36 cm; Wacker Siltronic, Freiberg, Germany were very slowly dissolved in the respective acid mixture at a temperature of −1°C. During the dissolution, the vessels were covered by Teflflon caps.
Results
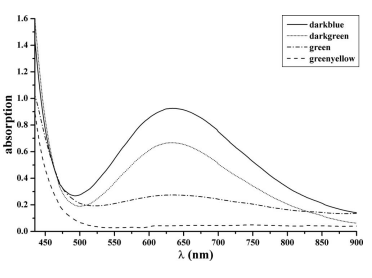
Species in solution.— The dissolution of silicon in a pure HF/HNO3 mixture at room temperature causes a vigorous evolution of brown nitrogen oxide gases. The etch solution turns brown if a suffificiently high concentration of these gases is dissolved. The color does not change if more silicon is dissolved. A slow decoloration of the solutions via yellow to transparent and a steady gas evolution could be observed if the solutions were simply exposed to air. If the dissolution process is carried out below 15°C, the solution turns green. Furthermore, at temperatures of 1°C, a blue etch mixture is obtained. In comparison to experiments made at 25°C, the generation of nitrogen oxide gases is signifificantly moderate at 1°C.
The identifification of N2O3 in the concentrated etch solutions does not rule out that other nitrogen species in the oxidation state +3, such as NO+, or in the oxidation state +5, such as NO2 + , are present. The fact that only NO2 − and NO3 − were found in the 1:5000 dilution is clear evidence that any of these intermediates decompose by dilution and, hence, can be quantifified by ion chromatography. Throughout this work, the nitrite concentration as determined in diluted solution is fully synonymous for all N III species in concentrated solution.

Fig1
Hence to follow the proceeding series of experiments, the x axis of Fig. 3 has to be red from right to left. Two different regions can be identifified. The region in which the etch rate is independent of the nitrite concentration yielding a parallel line to the x axis is denoted as the plateau region. At a certain concentration of nitrite, which depends on the dissolved silicon content, a linear relationship between the etch rate and the nitrite concentration is observed and denoted as the slope region. The sole exception indicates the lowest graph of Fig. 3 of the highest studied silicon content, which only shows the slope region. Out of Fig. 2 it arises that a region is reached where the nitrite concentration already decreases although silicon dissolution continues. Here, the etch rate is so slow that due to the dissolution of silicon, less NO2 − is generated as consumed by conversion to nitrate and therefore a plateau region cannot be noticed. After the dissolution of the lowest investigated silicon content upper curve , the highest etch rates up to 1500 nm s−1 and the smallest maximum nitrite concentration were observed. The associated etch rates of Fig. 3 are merged in Table I.
The effect of stirring on the etch rate was investigated at constant silicon content in dependence on the nitrite concentration 1.4 g Si in 50 mL etch mixture Fig. 5 . Due to stirring, the clear distinction into the plateau and slope region, as found in experiments without stirring upper curve , is lost and leads to a decrease of the etch rates with increasing stirring speed at constant NO2 − . In Fig. 5, two regions with distinguishing slopes r/ NO2 − were achieved. Independent of the stirring rate, the plateau region turns into a region of linear dependence between etch rate and stirring velocity at a uniform slope. Therefore, in this region the inflfluence of stirring, hence the inflfluence of concentration of the reactive species at the silicon surface, can be seen Table II . In the slope region, where the etch rate decreases with decreasing nitrite concentration Fig. 3 , a simultaneous interaction of stirring and nitrite ion inflfluence on etch rate occurs.
上一篇: 太阳能电池减薄中酸性溴溶液的化学处理
下一篇: 用氯化铵水溶液实现氧化锌薄膜的可控蚀刻