HgCdTe is widely used for infrared detectors and focal-plane arrays. A good understanding of the link between material properties and device performance is critical for the development of modern devices such as multicolor detectors, high-operating-temperature detectors, avalanche photodiodes, and very long-wavelength infrared detectors.1–4 It has been recognized for a long time that minoritycarrier lifetime is a key fifigure of merit of HgCdTe and that there is a clear link between minoritycarrier lifetime and detector performance. Basically, the photosignal reaching the detector contact is proportional to the lifetime, and the thermal noise in the detector is inversely proportional to the lifetime.1,2
Two types of samples were used in this work. The fifirst set was grown by molecular-beam epitaxy (MBE) on Si(211) using a CdTe buffer layer. The second set was grown by liquid-phase epitaxy (LPE) on CdZnTe(111). The Cd concentration relative to Te was 0.33 for the MBE-grown samples and 0.23 for the LPE-grown samples, with dislocation densities on the order of 106 cm 2 and 105 cm 2 , respectively. The LPE samples were provided by DRS Technology and the MBE samples were grown at University of Illinois at Chicago (UIC) using a Riber 32P system. Details of both LPE10 and MBE11–13 grown samples are discussed elsewhere.
PCD was measured at temperatures between 300 K and 77 K using a pulsed AlGaAs solid-state laser (k = 905 nm) for excitation. In was used for electrical contacts since both samples show n-type conductivity as confifirmed by Hall-effect measurements, and the contacts were checked for ohmic behavior over the entire temperature range. Particular care was taken to minimize exposure to air prior to the fifirst PCD measurements.
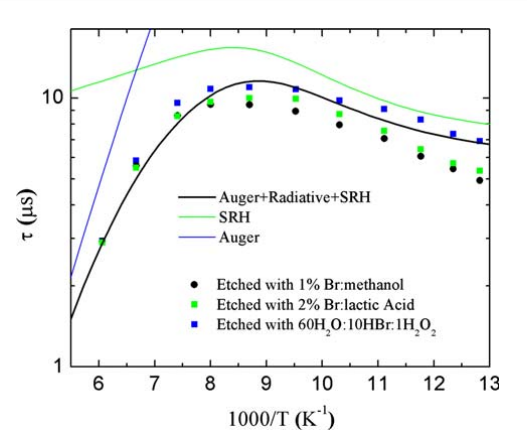
Figure 1 shows PCD curves measured on LPE-grown HgCdTe samples after etching in three different solutions. All samples were cut from the same wafer. At 80 K, the slope is clearly different, with the Br-based etchants giving the lower effective lifetime. At 135 K, there is no signifificant difference between samples etched in any of the three etchants. It is tempting to plot an effective lifetime, extracted from PCD measurements, versus reciprocal temperature. An example is shown in Fig. 2. The solid curves are from a theoretical model; more details can be found in Refs. 15 and 16.

Fig2
Narrow scans of some of the strongest core-level peaks can provide more information about the surface composition. There is no evidence of multiple peaks in the Hg and Cd core-level spectra after etching. This is shown as an example in Fig. 3 for a sample etched in Br:methanol. Although it may be diffificult to resolve Cd or Hg oxide peaks on HgCdTe surfaces, we suggest that this is a sign of negligible oxidation of Cd and Hg on our samples. This is further confifirmed by the fact that, even after prolonged exposure to air, the shape of these core-level spectra does not change at all; only an insignifificant shift in binding energy is observed.
Te 3d spectra show a more complex structure than Cd 3d or Hg 4f. Using least-squares peak fifitting, they are decomposed into a number of mixed Gaussian–Lorentzian peaks. These peaks are described by their height, position, width, and mixing ratio (100% = purely Gaussian, 0% = purely Lorentzian). We always started with the smallest number of peaks that was immediately obvious from the XPS spectra. The fifit was accepted if the results, especially the width, mixing ratios, and binding energy shifts, were consistent with our results from a large number of samples measured under similar conditions. Otherwise, a new attempt was made with an additional peak. Finally, for some samples we checked that similar results were obtained from fifitting the Te 3d5/2 peak or the Te 4d doublet.
上一篇: 湿化学处理后InP表面的研究