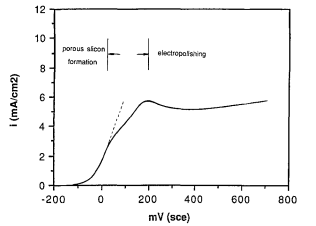
The anodic current-potential characteristics of four types of silicon in HF aqueous solutions have been studied. According to the surface condition of the samples anodized at different potentials, there are generally three regions on a current-potential curve: porous silicon formation in the region where current changes exponentially with potential, electropolishing of silicon in the constant current region, and a transition region in between. A diagram is presented to indicate the anodic conditions for porous silicon formation and electropolishing for the silicon samples studied. Porous silicon formation is considered to be the result of the competition reactions between silicon oxide formation with H20 and direct dissolution of silicon by HF. Polishing of silicon occurs through dissolution of the oxide film when it completely covers the silicon surface.
Porous silicon can be formed by anodic polarization of silicon in hydrofluoric acid. It was first reported in 1958 by Turner in his study of the electropolishing of silicon in hydrofluoric acid solutions (1). Recently, porous silicon has found applications in isolation technology for fabrication of integrated circuits, particularly in silicon-on-insulator (SOI) .
Table I shows the silicon samples used in this study. The back side of the silicon was coated with a layer of aluminum to provide a low-resistance electrical contact. Except for the exposed surface, the silicon specimen and a copper strip for electrical connection were sealed with black wax. The exposed surface area was 0.38 cm 2.
The solutions were prepared by adding deionized water to 49 weight percent (w/o) HF to the desired concentrations. The experiments were conducted at room temperature, about 22~ Except for n-type samples, which were tested in the dark, no screening was used for any experiments, since ambient lighting was found to have z~o affect on the results. Before each test, the silicon electrodes were degreased with methanol and washed in deionized water. The electrode potential was controlled with an EG&G PAR (Model 273) potentiostat and the current was plotted with an X-T recorder.

Fig1
Figure 1 shows a typical plot of current vs. potential characteristics of p§ silicon in 1% HF solution. Anodic current increases exponentially with the electrode potential at low potentials. As the potential is increased, the current exhibits a peak and then remains at a relatively constant value. The current increases slightly again with further increasing potential.
Since porous silicon is formed during the i-V curve measurement and it increases in thickness as the measurement continues, the electrode surface condition is different at each potential. Several i-V curves were measured successively on the same sample to determine whether the porous silicon layer and its thickness influence the i-V characteristics. The result is shown in Fig. '3. With the exception of the first i-V curve, successive curves are virtually the same. Figure 4 shows the effect of potential sweep rate on the i-V curve for p+ sample in 1% HF solution. The i-V curves are similar for different sweep rates in a range from 2 mV/s to 100 mV/s.
下一篇: 氢氟酸水溶液中离子辐照LiNbO3的蚀刻